Fig. 4
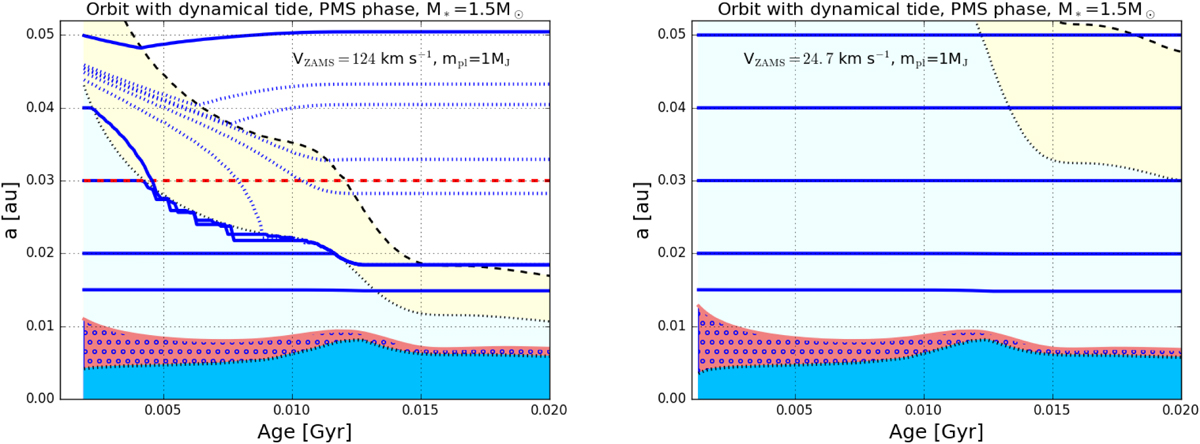
Left panel: same as the left panel of Fig. 2, but the mass of the star is 1.5 M⊙. The blue continuous and dotted curves show the evolution of the orbits for planets starting their evolution at various initial distances from their host star. The continuous curves show the orbital evolution for initial distances of 0.05, 0.04, 0.03, 0.02, and 0.015 au. The black dashed and dotted curves show acorot and amin for the case starting at 0.05 au, respectively. The horizontal dashed red line is the orbit starting at 0.03 au computed considering only the equilibrium tide. The pale blue region covers the zone below amin (no dynamical tide active). The yellow region indicates where dynamical tides are active and tend to shrinkthe orbit (for the distance 0.05 au). The white area corresponds to zones where tides tend to widen the orbit (for the distance 0.05 au). Right panel: same as the left panel, but the 1.5 M⊙ stellar model has a slower rotation.
Current usage metrics show cumulative count of Article Views (full-text article views including HTML views, PDF and ePub downloads, according to the available data) and Abstracts Views on Vision4Press platform.
Data correspond to usage on the plateform after 2015. The current usage metrics is available 48-96 hours after online publication and is updated daily on week days.
Initial download of the metrics may take a while.