Fig. 3
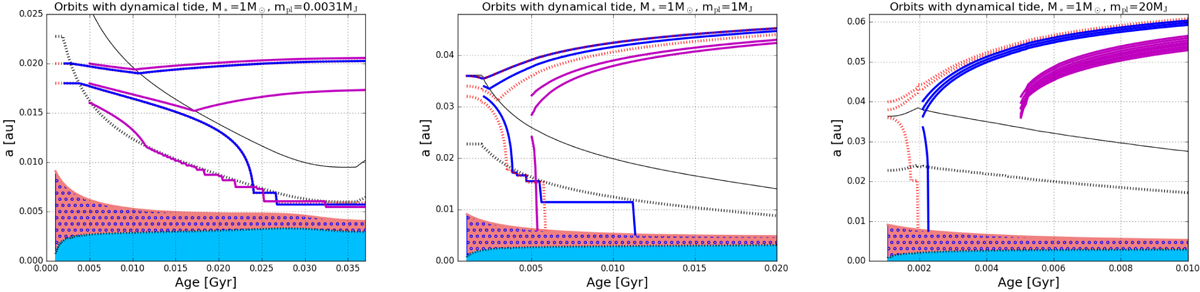
Evolution of the orbits of 0.0031 (Earth-mass planet), 1 and 20 Jupiter mass planets around a 1 M⊙ star, starting their orbital evolution at different times and distances to their host star. The red dotted lines show planets beginning their evolution at 1 Myr, the continuous blue line shows planets at 2 Myr, and the continuous magenta line shows planets at 5 Myr. The black continuous line depicts the corotation radius, and the black dotted line represents amin. These quantities correspond to cases where the starting time is 1 Myr. For the 0.0031 (one Earth-mass planet), 1 and 20 Jupiter mass planet, they correspond to initial distances equal to 0.1, 0.036, and 0.04 au, respectively. The colored regions havethe same meaning as in the left panel of Fig. 2.
Current usage metrics show cumulative count of Article Views (full-text article views including HTML views, PDF and ePub downloads, according to the available data) and Abstracts Views on Vision4Press platform.
Data correspond to usage on the plateform after 2015. The current usage metrics is available 48-96 hours after online publication and is updated daily on week days.
Initial download of the metrics may take a while.