Fig. 2
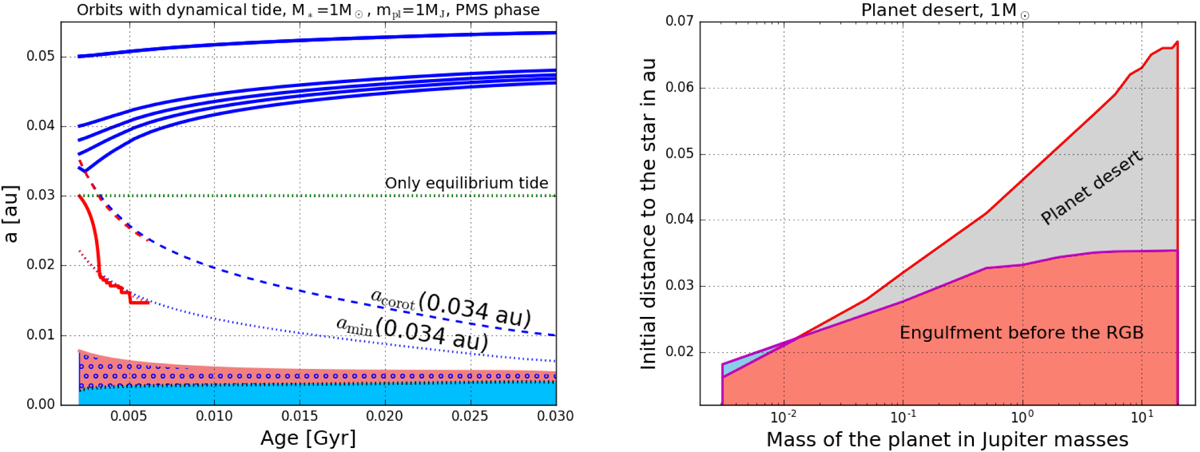
Left panel: evolution as a function of time of the orbits of Jupiter mass planets around a 1 M⊙ star (continuous lines). Different initial distances to the star are considered. Blue lines show cases where tides tend to widen the orbits, and the red line shows a case where the orbit shrinks. Only the beginning of the evolution is shown (see text). The blue dashed and dotted lines show the corotation (acorot) and the critical distance below which dynamical tides are no longer active (amin), respectively.The blue dashed and dotted lines correspond to the case when the initial distance is 0.034 au. The red dashed and dotted lines have the same meaning as the blue dashed and dotted lines, but correspond to an initial distance of 0.030 au. The green dotted line is the orbit for a planet starting at 0.03 au where the dynamical tide is neglected. The upper limit of the pink zone with blue circles corresponds to the radius of the star in au. Its lower limit shows the radius at the base of the stellar convective envelope. The blue zone indicates the size of the stellar radiative interior. Right panel: the red zone shows the region in the initial distance vs. planet mass plane where an engulfment occurs during the PMS phase. The upper limit of the light gray zone shows the minimum distance at which a planet beginning its evolution at a distance inside the light gray zone is moved by tides. This gray zone is thus devoid of planets, not because of engulfment but because the orbit expands. The blue region may contain planets. Planets can be present in that region only if they have begun their evolution above the blue zone and have evolved there because of a net shrinking of their orbit (see text). Planets that have an initial distance inside the blue region are engulfed.
Current usage metrics show cumulative count of Article Views (full-text article views including HTML views, PDF and ePub downloads, according to the available data) and Abstracts Views on Vision4Press platform.
Data correspond to usage on the plateform after 2015. The current usage metrics is available 48-96 hours after online publication and is updated daily on week days.
Initial download of the metrics may take a while.