Fig. 3.
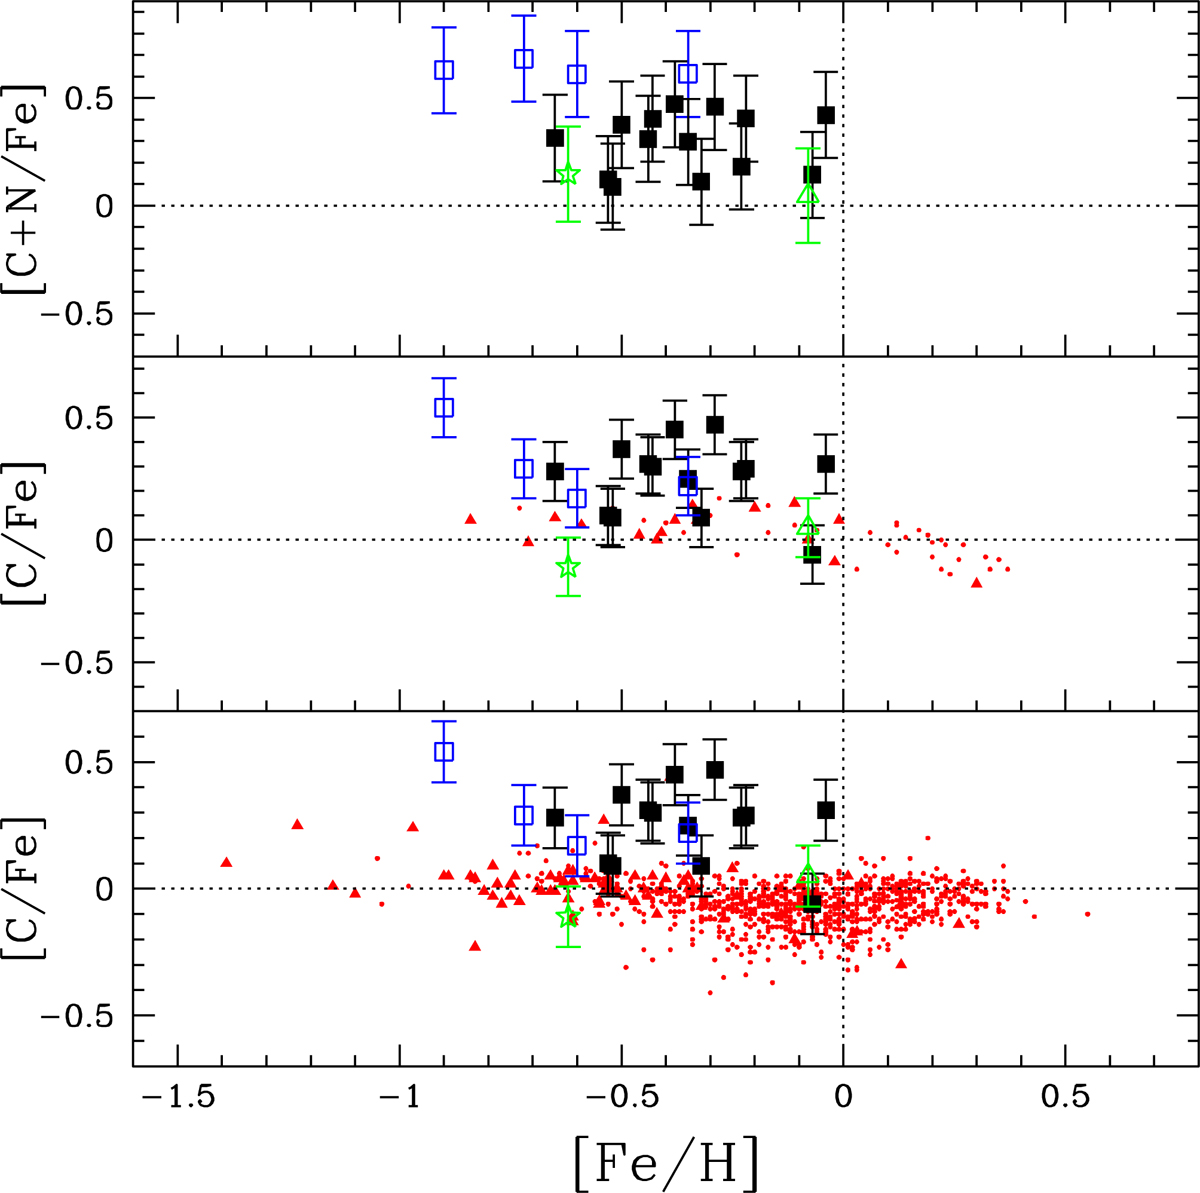
Abundances of C (bottom and middle panels) and C+N (top panel) in our programme stars, as a function of metallicity (symbols defined in Fig. 2). The C abundances of thick disc (red triangles) and thin disc (red dots) stars from (Bensby & Feltzing 2006; middle panel) and (Suarez-Andres et al. 2017; bottom panel) are also shown to outline the Galactic trend.
Current usage metrics show cumulative count of Article Views (full-text article views including HTML views, PDF and ePub downloads, according to the available data) and Abstracts Views on Vision4Press platform.
Data correspond to usage on the plateform after 2015. The current usage metrics is available 48-96 hours after online publication and is updated daily on week days.
Initial download of the metrics may take a while.