Free Access
Fig. 15
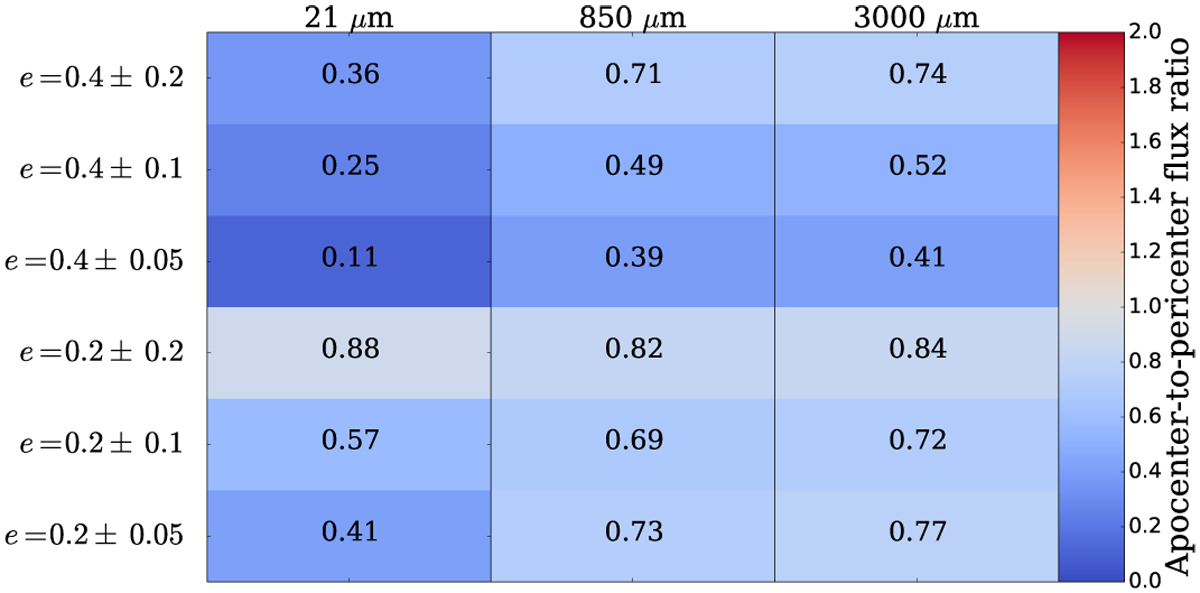
Apocenter-to-pericenter flux ratio for different observing wavelengths λobs (21, 850, and3000 μm) as a functionof dynamical excitation Δeb (reference material strength). The number in each box indicates the apocenter-to-pericenter flux ratio.
Current usage metrics show cumulative count of Article Views (full-text article views including HTML views, PDF and ePub downloads, according to the available data) and Abstracts Views on Vision4Press platform.
Data correspond to usage on the plateform after 2015. The current usage metrics is available 48-96 hours after online publication and is updated daily on week days.
Initial download of the metrics may take a while.