Open Access
Fig. 8.
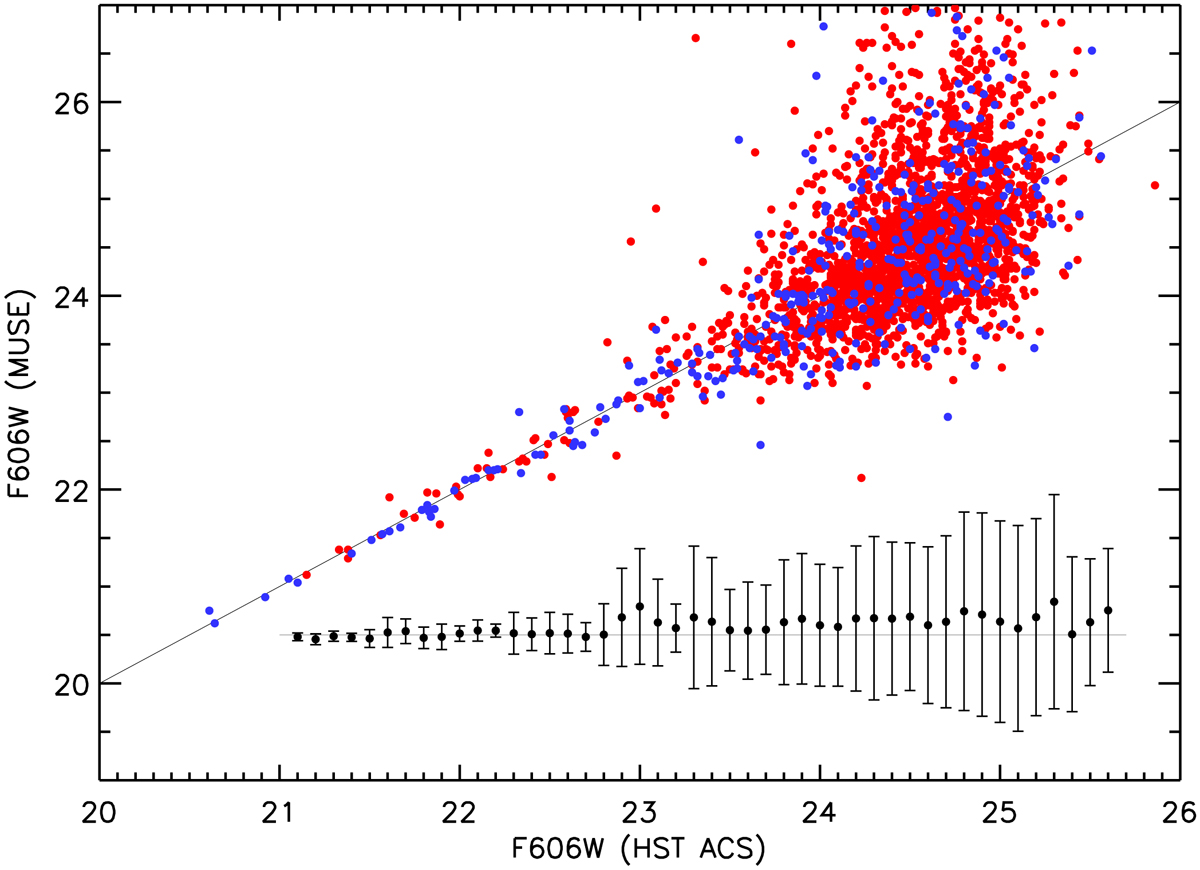
MUSE F606W photometry versus HST ACS magnitudes, broken down into cool stars (red dots) and hot stars (blue dots). Mean residuals against the 1:1 relation in 0.2 dex mag bins are shown as black dots. The error bars indicate the standard deviation while the gray horizontal line indicates zero.
Current usage metrics show cumulative count of Article Views (full-text article views including HTML views, PDF and ePub downloads, according to the available data) and Abstracts Views on Vision4Press platform.
Data correspond to usage on the plateform after 2015. The current usage metrics is available 48-96 hours after online publication and is updated daily on week days.
Initial download of the metrics may take a while.