Open Access
Fig. 4.
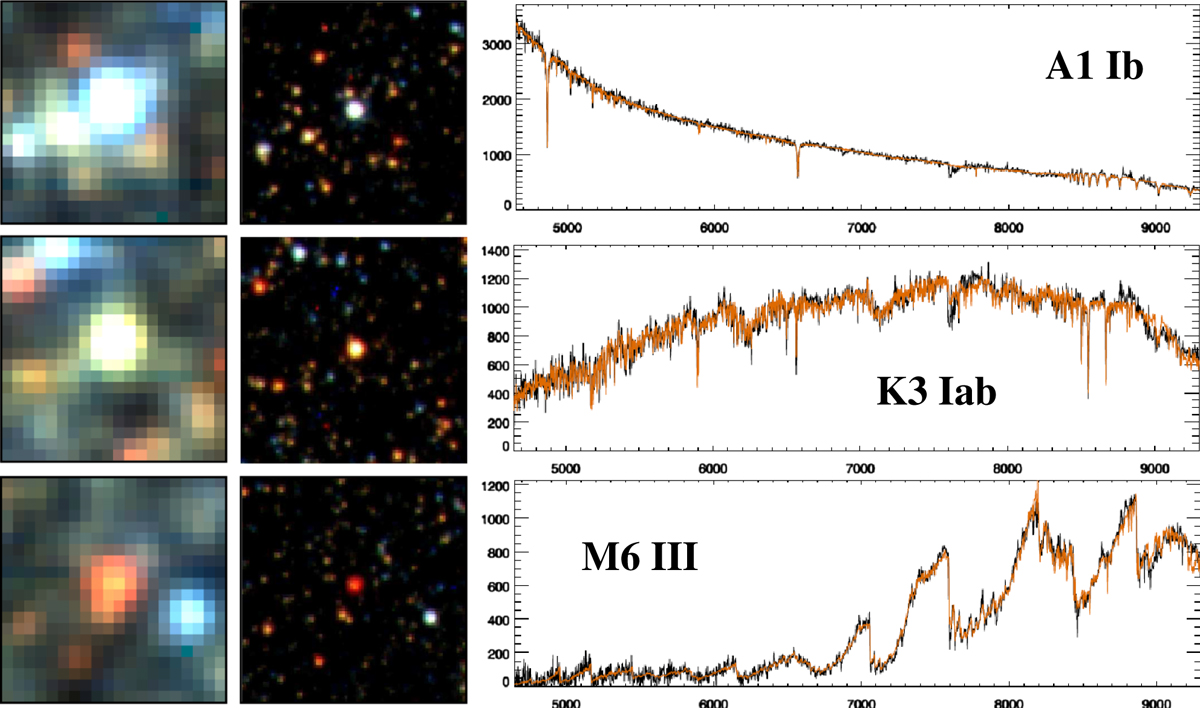
Example spectra from field (i). Images in the two columns to the left are analogous to Fig. 3. The spectra cover the full extended MUSE wavelength range of 4600 … 9300 Å. Flux is plotted in units of 10−20 erg cm−2 s−1 Å−1. Black curves: observed spectra; orange: ULySS fits.
Current usage metrics show cumulative count of Article Views (full-text article views including HTML views, PDF and ePub downloads, according to the available data) and Abstracts Views on Vision4Press platform.
Data correspond to usage on the plateform after 2015. The current usage metrics is available 48-96 hours after online publication and is updated daily on week days.
Initial download of the metrics may take a while.