Fig. 3.
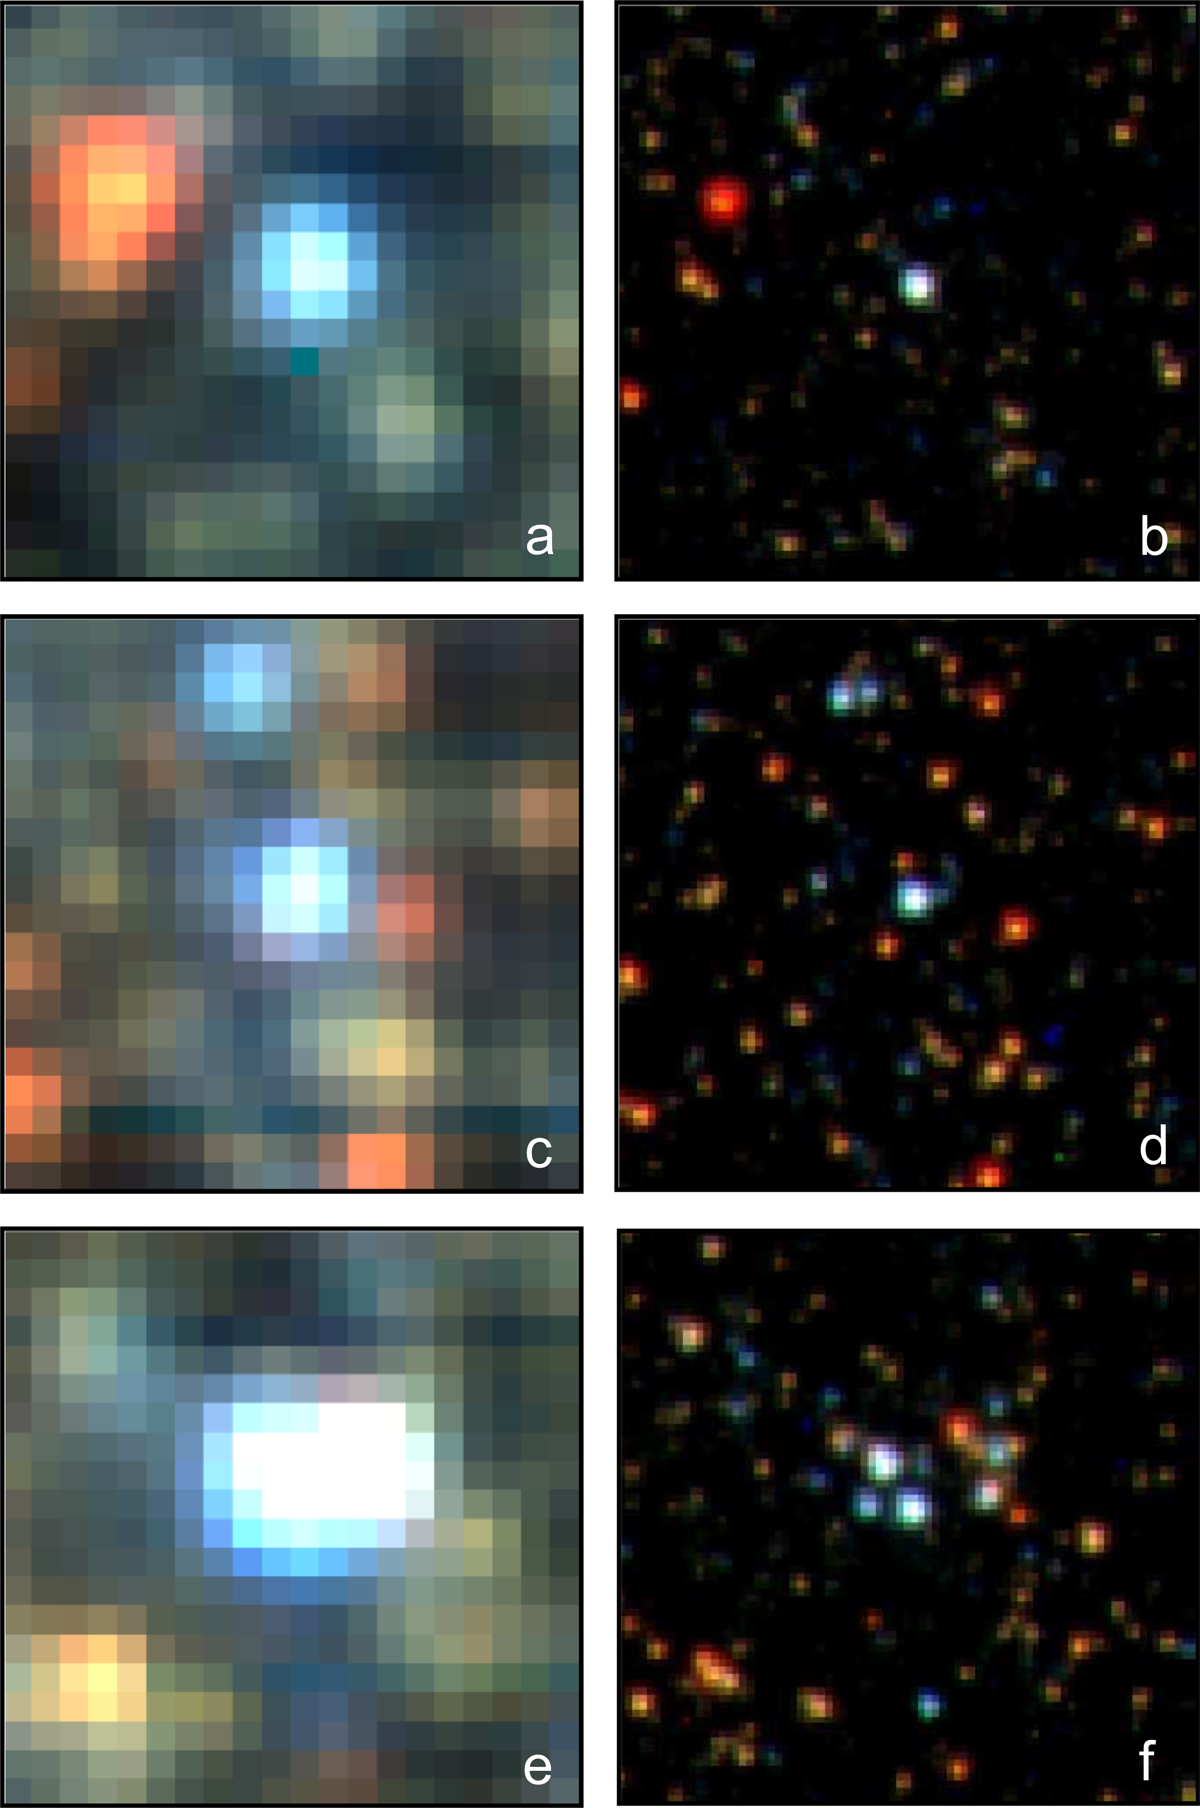
MUSE vs. HST images of 4 × 4 arcsec2 size from field (i), as examples of the star in the center being affected by different severity of crowding. a/b: ID1154, A1 Ib star, unblended. c/d: ID1179, B3 III star, negligible blending. e/f: ID995, central star cluster in bright H II region, spectrum heavily affected by blending and nebular emission, no reliable classification possible.
Current usage metrics show cumulative count of Article Views (full-text article views including HTML views, PDF and ePub downloads, according to the available data) and Abstracts Views on Vision4Press platform.
Data correspond to usage on the plateform after 2015. The current usage metrics is available 48-96 hours after online publication and is updated daily on week days.
Initial download of the metrics may take a while.