Open Access
Fig. 24.
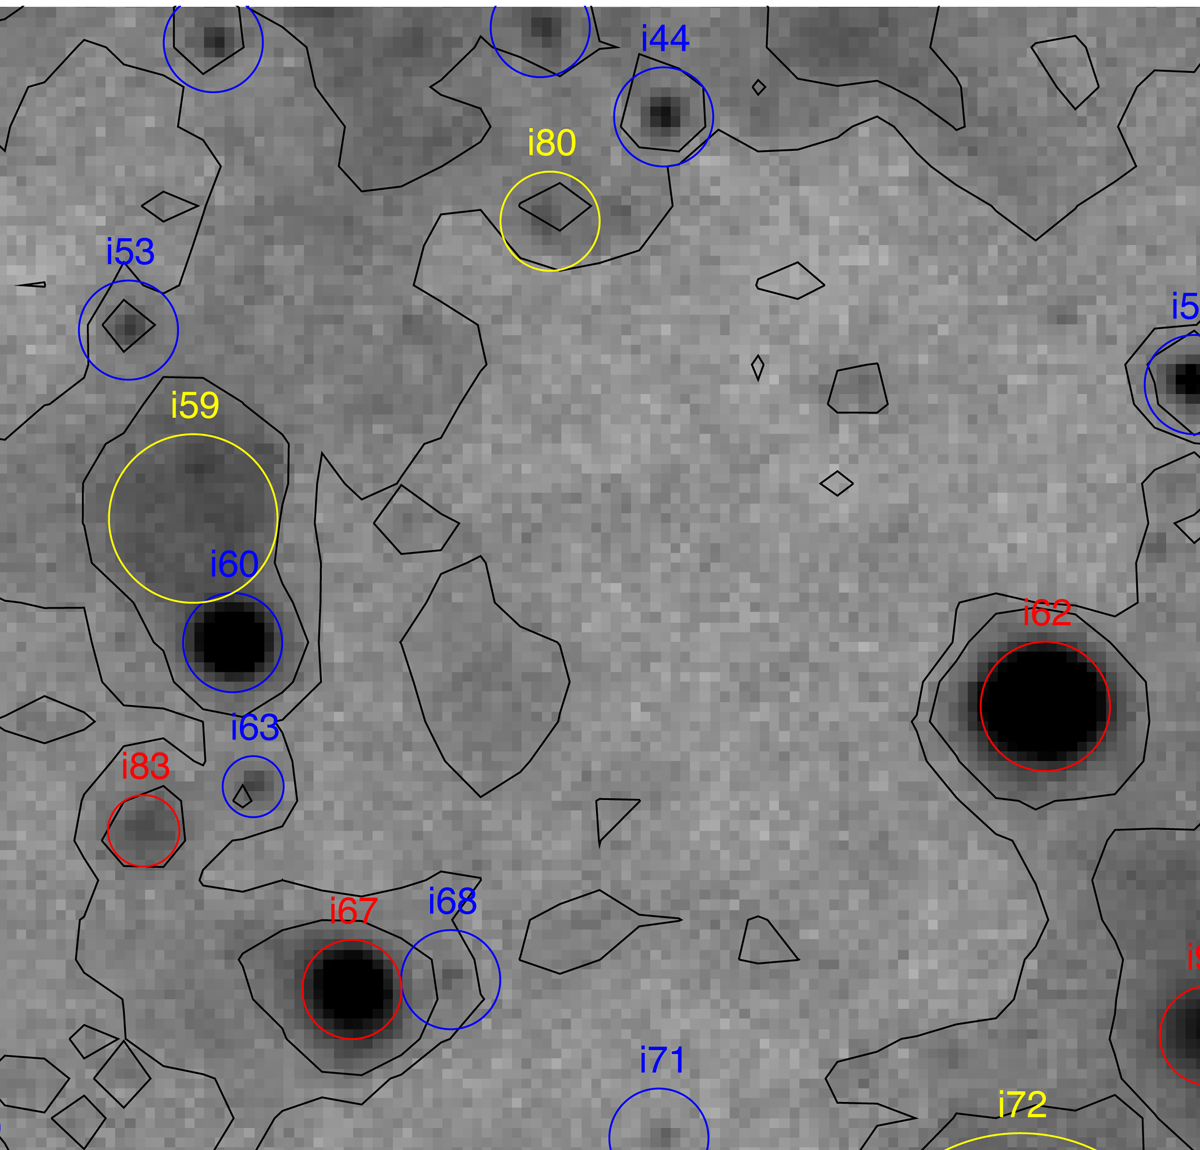
Hα image around the LBV candidate i60 (blue circle to the left) in field (i), covering 245 × 320 pc2. Red and yellow circles indicate H II regions and SNR, respectively. Contours at surface brightness levels of 1.5 and 2 × 10⁻¹⁷ erg cm−2 s−1 arcsec−2.
Current usage metrics show cumulative count of Article Views (full-text article views including HTML views, PDF and ePub downloads, according to the available data) and Abstracts Views on Vision4Press platform.
Data correspond to usage on the plateform after 2015. The current usage metrics is available 48-96 hours after online publication and is updated daily on week days.
Initial download of the metrics may take a while.