Fig. 23.
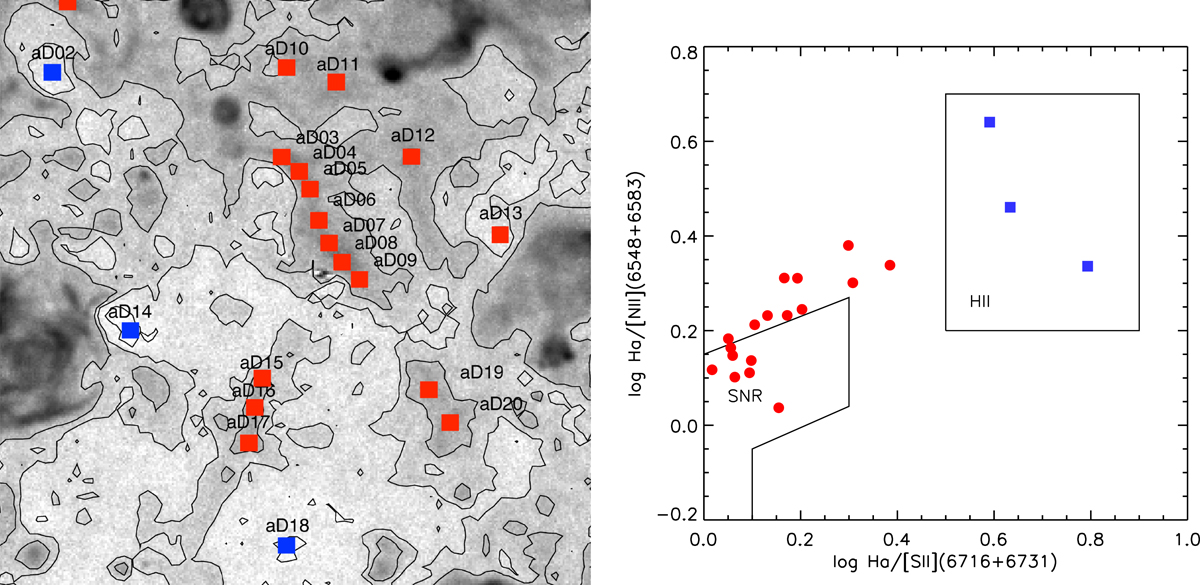
Left: continuum-subtracted [S II] image of diffuse ionized gas in field (a). Contours are set to surface brightness levels of 0.5, 1.0, and 1.5 × 10⁻¹⁷ erg cm−2 s−1 arcsec−2. Right: diagnostic diagram to distinguish photoionization from shock excitation according to Sabbadin et al. (1977). Red plot symbols correspond to shock ionized filaments aD03 … aD09, aD15 … aD17, etc., and blue symbols to photoionized local surface brightness mimima aD02, aD14, aD18 (see text).
Current usage metrics show cumulative count of Article Views (full-text article views including HTML views, PDF and ePub downloads, according to the available data) and Abstracts Views on Vision4Press platform.
Data correspond to usage on the plateform after 2015. The current usage metrics is available 48-96 hours after online publication and is updated daily on week days.
Initial download of the metrics may take a while.