Fig. 20.
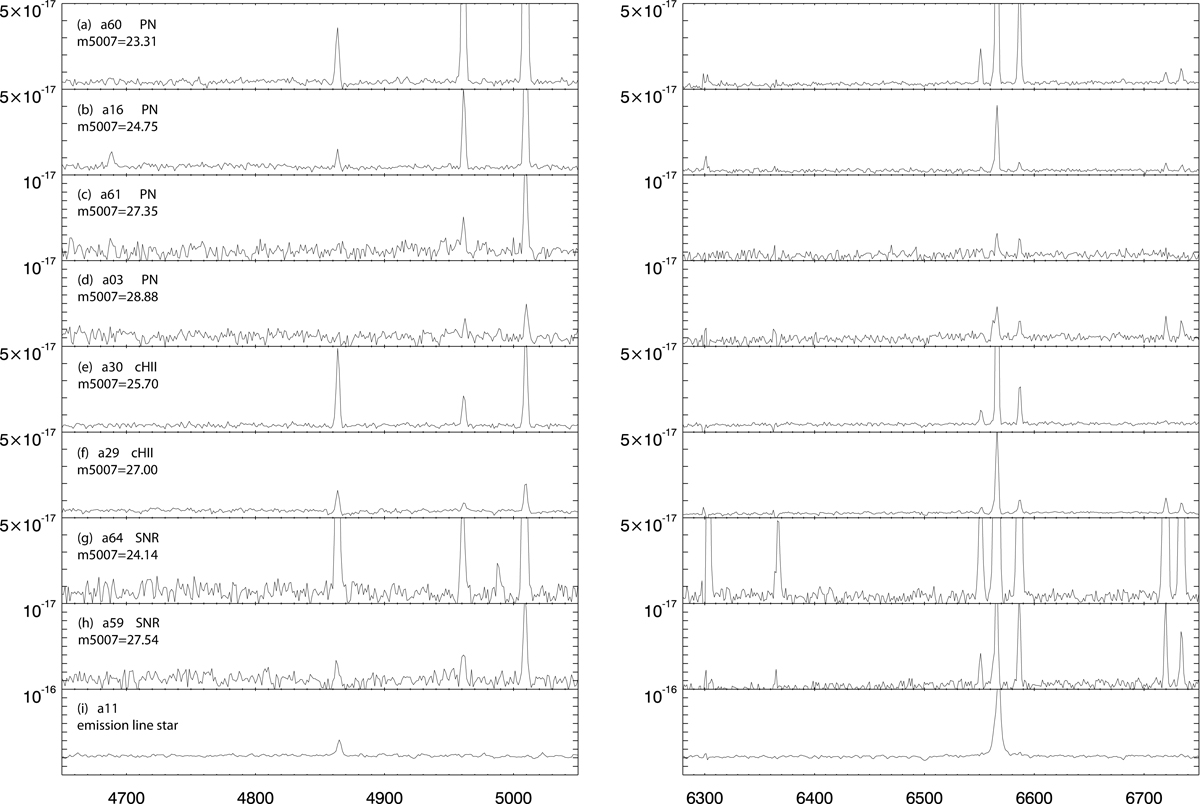
Example spectra of PNe, cHII, SNR, and an emission line star in units of erg cm−2 s−1 per 1.25 Å spectral bin in the Hβ-[O III] and Hα regions, plotted against wavelength in Å. The spectra are offset by some arbitrary bias to better show the noise level. Panels a–d: PNe over the full range from the brightest to the faintest objects. The very faint object a03 with m5007 = 28.88 is an uncertain PN candidate, given that the [SII] line ratio, although critically dependent on diffuse nebular background subtraction, could also be indicative of a cHII, or even a SNR. Panels e, f: a bright and a faint cHII, and panels g, h: a bright and a faint SNR. Panel i: an emission line star is shown, presenting an Hα emission line width of 6.6 Å.
Current usage metrics show cumulative count of Article Views (full-text article views including HTML views, PDF and ePub downloads, according to the available data) and Abstracts Views on Vision4Press platform.
Data correspond to usage on the plateform after 2015. The current usage metrics is available 48-96 hours after online publication and is updated daily on week days.
Initial download of the metrics may take a while.