Fig. 18.
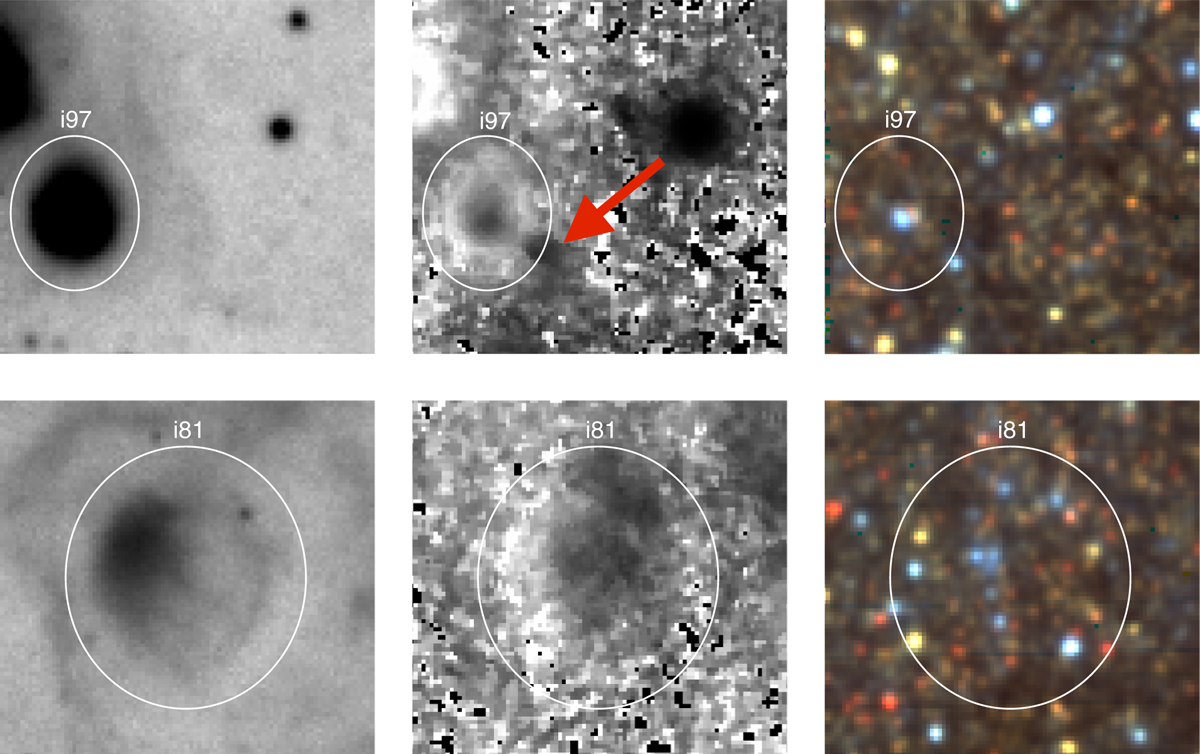
Ionization parameter mapping of two H II regions, from left to right: Hα, [S II]/[O III], VRI. The grayscale for the Hα maps shows high intensity in black, whereas the IPM maps feature high ratios in white. The region i97 (top row, 4.8″ × 5.8″) is optically thick, while i81 (bottom, 10.4″ × 11.8″) is apparently leaking ionizing radiation, a “blister” in the nomenclature of Pellegrini et al. (2012). A strange, [O III]-bright feature near the rim of i97 is indicated by an arrow (see text). The stars that are likely responsible for the ionization of the nebulae are visible as blue objects in the VRI images.
Current usage metrics show cumulative count of Article Views (full-text article views including HTML views, PDF and ePub downloads, according to the available data) and Abstracts Views on Vision4Press platform.
Data correspond to usage on the plateform after 2015. The current usage metrics is available 48-96 hours after online publication and is updated daily on week days.
Initial download of the metrics may take a while.