Open Access
Fig. 14.
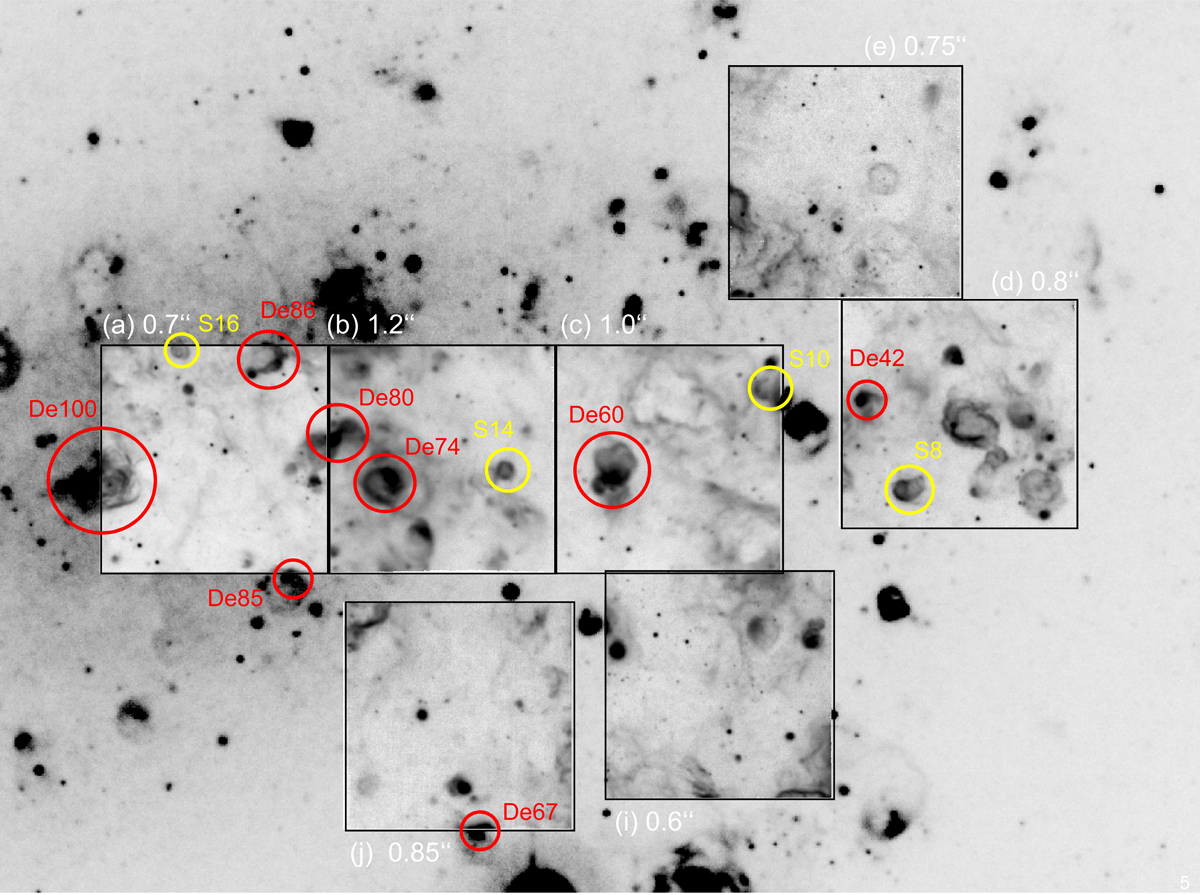
Hα images reconstructed from MUSE data cubes for pointings (a), (b), …, (j). The background image is from the ESO/MPI 2.2 m WFI (credit: F. Bresolin). H II regions in common with the catalog of Deharveng et al. (1988) are indicated with red circles. Yellow circles denote the SNR recorded by Blair & Long (1997).
Current usage metrics show cumulative count of Article Views (full-text article views including HTML views, PDF and ePub downloads, according to the available data) and Abstracts Views on Vision4Press platform.
Data correspond to usage on the plateform after 2015. The current usage metrics is available 48-96 hours after online publication and is updated daily on week days.
Initial download of the metrics may take a while.