Open Access
Fig. 10.
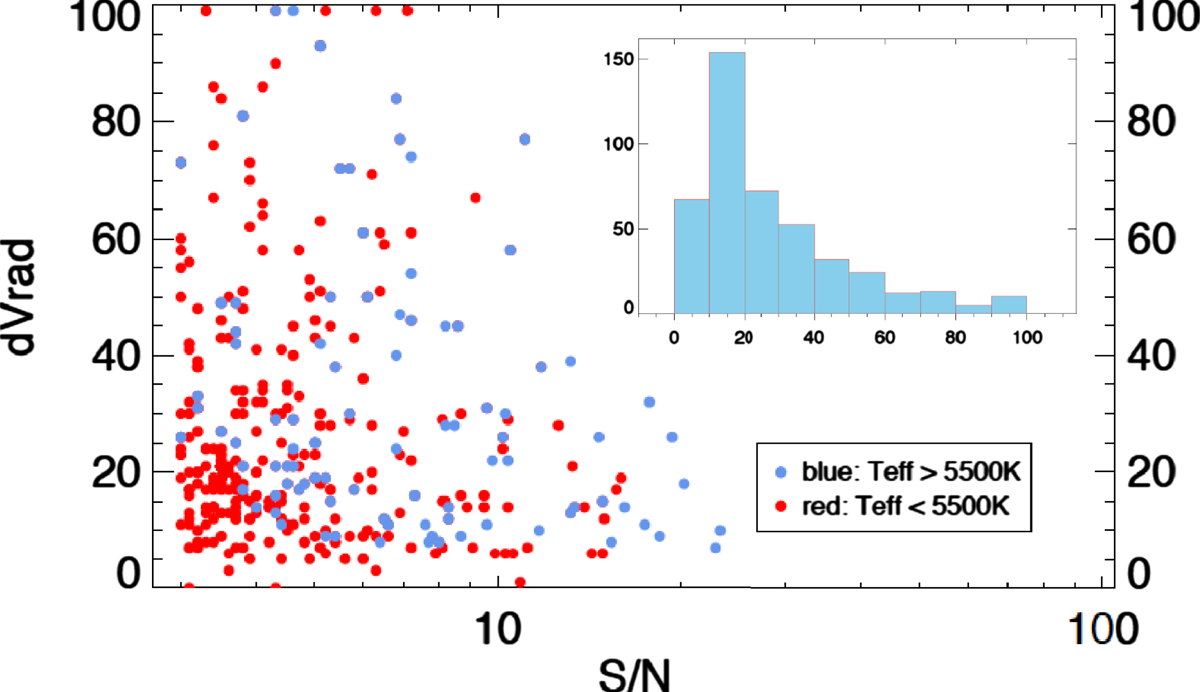
Radial velocity uncertaintites ∆vrad plotted against S/N. The sample is segregated into hot and cool stars as in Fig. 7. The insert shows a histogram of the ∆vrad distribution, the 50th percentile at 20 km s−1.
Current usage metrics show cumulative count of Article Views (full-text article views including HTML views, PDF and ePub downloads, according to the available data) and Abstracts Views on Vision4Press platform.
Data correspond to usage on the plateform after 2015. The current usage metrics is available 48-96 hours after online publication and is updated daily on week days.
Initial download of the metrics may take a while.