Fig. 9.
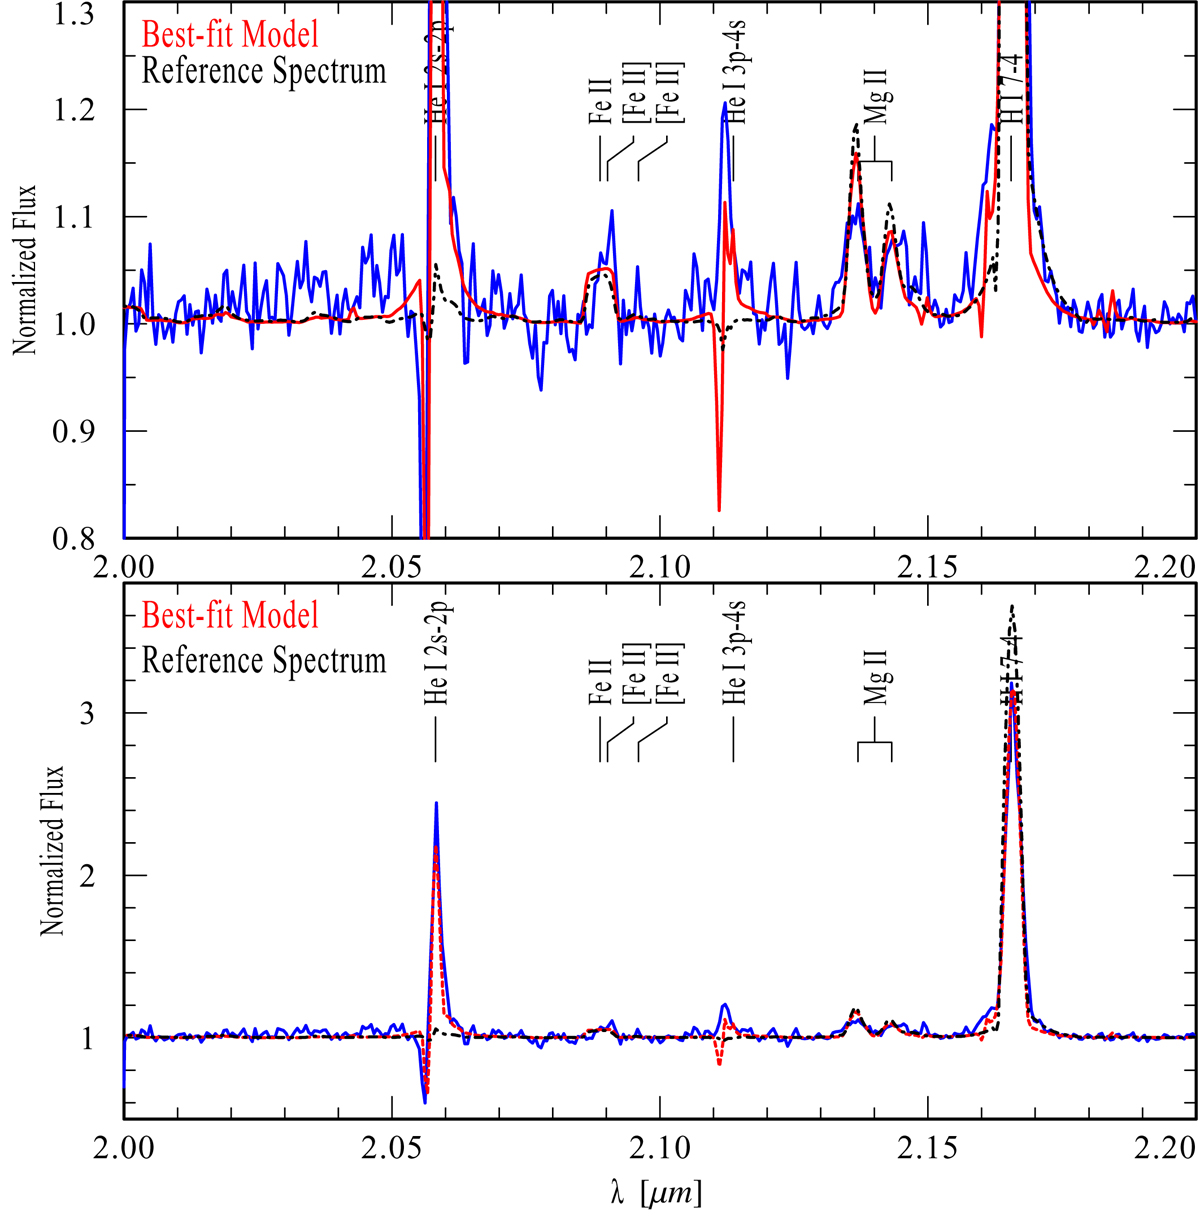
Lower panel: GRAVITY spectrum from 2.0 μm to 2.2 μm (blue-solid line) with a vertical scale that displays the complete line profiles. Upper panel: magnification of the GRAVITY spectrum, where the fine details of our best-fit model (red-dashed line) and of the reference spectrum derived with the stellar parameters from Groh et al. (2012a) (black-dashed line) are appreciated. Notice that the He I 2s-2p and He I 3p-4s are only matched by our hotter red model.
Current usage metrics show cumulative count of Article Views (full-text article views including HTML views, PDF and ePub downloads, according to the available data) and Abstracts Views on Vision4Press platform.
Data correspond to usage on the plateform after 2015. The current usage metrics is available 48-96 hours after online publication and is updated daily on week days.
Initial download of the metrics may take a while.