Fig. 8.
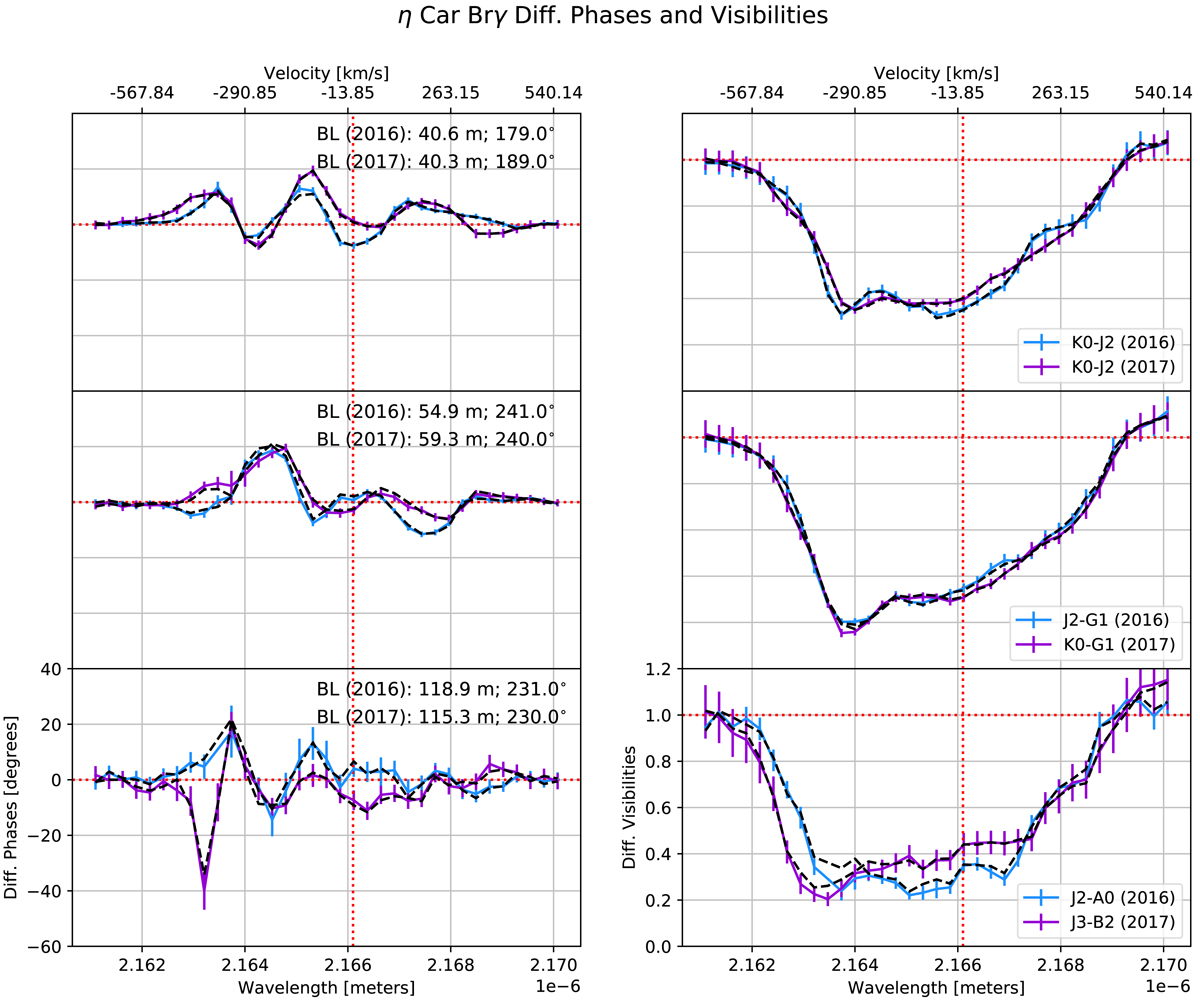
Differential phases (left panels) and differential visibilities (right panels) between the continuum and the line emission for the 2016 (blue line) and 2017 data (purple line). The (reference) continuum phase and visibility were estimated using the first and last five channels in the imaged bandpass. Each one of the rows corresponds to a similar baseline in both epochs, tracing large (top), intermediate (middle) and small (bottom) spatial scales. The baseline lengths and position angles are labeled on the left panels, while the baseline stations are labeled on the right ones. The black-dashed lines correspond to the differential quantities extracted from the unconvolved reconstructed images. The vertical red-dotted line marks the systemic velocity of Brγ. The horizontal red-dotted lines show the continuum baselines.
Current usage metrics show cumulative count of Article Views (full-text article views including HTML views, PDF and ePub downloads, according to the available data) and Abstracts Views on Vision4Press platform.
Data correspond to usage on the plateform after 2015. The current usage metrics is available 48-96 hours after online publication and is updated daily on week days.
Initial download of the metrics may take a while.