Fig. 6.
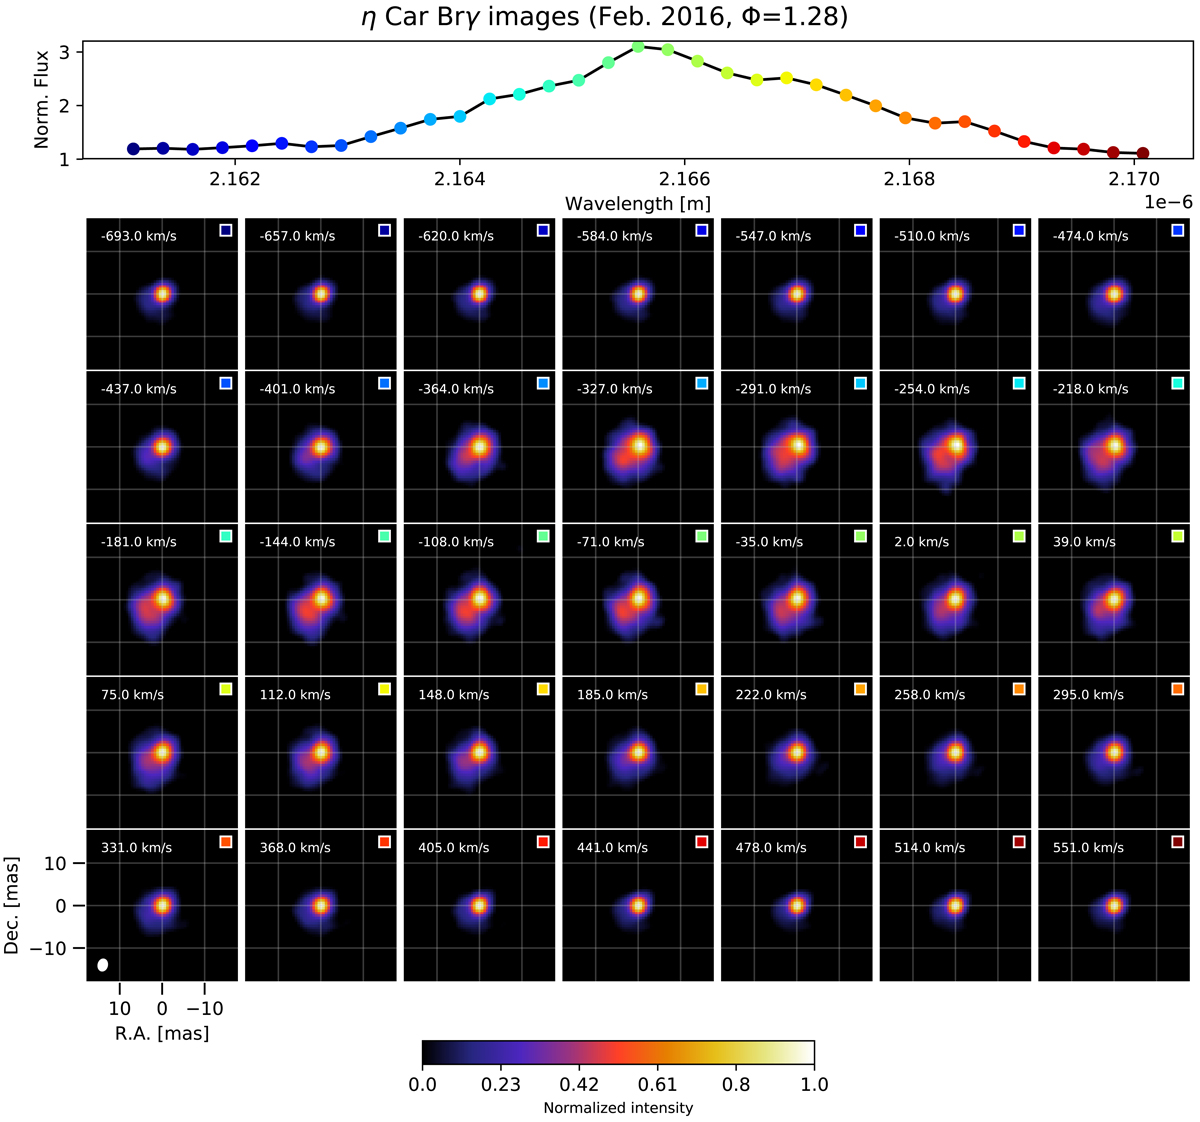
Brγ interferometric aperture synthesis images from the Feb. 2016 data. The Doppler velocity of each frame is labeled in the images. For all the panels, east is to the left and north to the top. The displayed FOV corresponds to 36 × 36 mas. The small white ellipse shown in the lowermost-left panel corresponds to the synthesized primary beam (the detailed PSF is shown in Fig. D.1). Above all the images, the GRAVITY spectrum is shown and the different positions where the images are reconstructed across the line are labeled with a colored square, which is also plotted in the images for an easy identification.
Current usage metrics show cumulative count of Article Views (full-text article views including HTML views, PDF and ePub downloads, according to the available data) and Abstracts Views on Vision4Press platform.
Data correspond to usage on the plateform after 2015. The current usage metrics is available 48-96 hours after online publication and is updated daily on week days.
Initial download of the metrics may take a while.