Fig. 4.
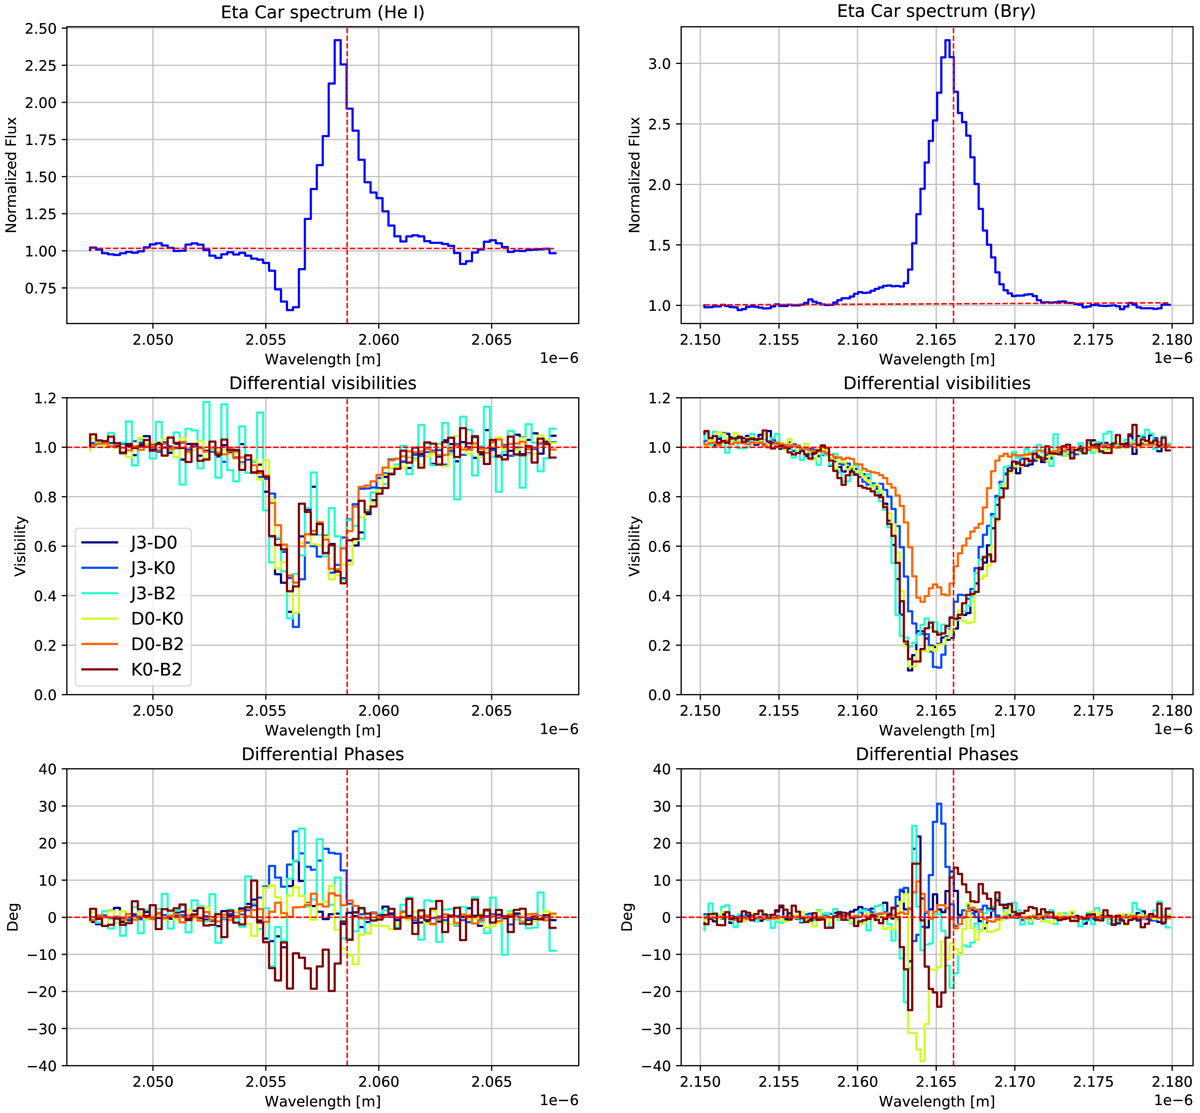
Normalized GRAVITY spectrum at the position of the He I 2s-2p and Brγ lines. The calibrated differential visibilities (middle) and phases (bottom) of one of the GRAVITY data sets (MJD: 57903.9840) are also shown. In the middle and bottom panels, different colors correspond to each one of the baselines in the data set (see label on the plots). The dashed-red vertical lines indicate the reference wavelength of the emission feature, and the dashed-horizontal lines show the reference value of the continuum baseline.
Current usage metrics show cumulative count of Article Views (full-text article views including HTML views, PDF and ePub downloads, according to the available data) and Abstracts Views on Vision4Press platform.
Data correspond to usage on the plateform after 2015. The current usage metrics is available 48-96 hours after online publication and is updated daily on week days.
Initial download of the metrics may take a while.