Fig. F.1.
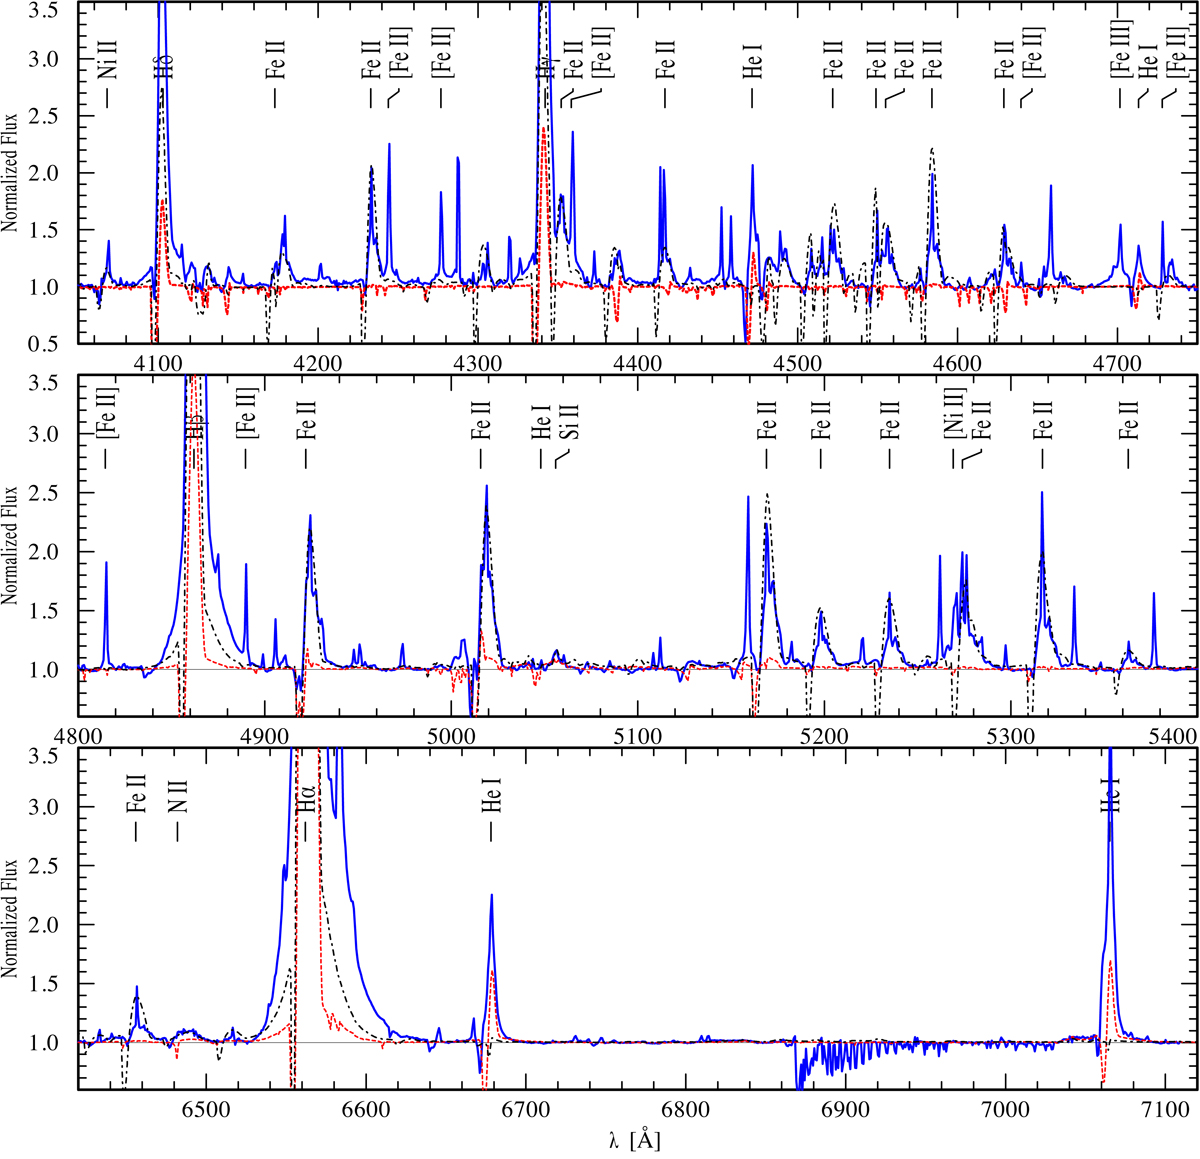
2016 η Car’s FEROS spectrum (blue-solid line). The image displays our best-fit CMFGEN model (red-dashed line) and the model described in Groh et al. (2012a; black-dashed line). The Balmer lines of the FEROS spectrum are too strong. They include large contributions of the circumstellar emission as a result of the bad seeing of ∼2″ at the time of the observation. The black synthetic spectrum matches the Fe II and Si II lines. The absorption component of the P-Cygni profiles are filled in and the He I emission lines are not reproduced by the model, which has been already observed and discussed in detail by Hillier et al. (2001). The hotter red model can hardly fit the spectral lines observed at FEROS’ wavelengths.
Current usage metrics show cumulative count of Article Views (full-text article views including HTML views, PDF and ePub downloads, according to the available data) and Abstracts Views on Vision4Press platform.
Data correspond to usage on the plateform after 2015. The current usage metrics is available 48-96 hours after online publication and is updated daily on week days.
Initial download of the metrics may take a while.