Fig. E.1.
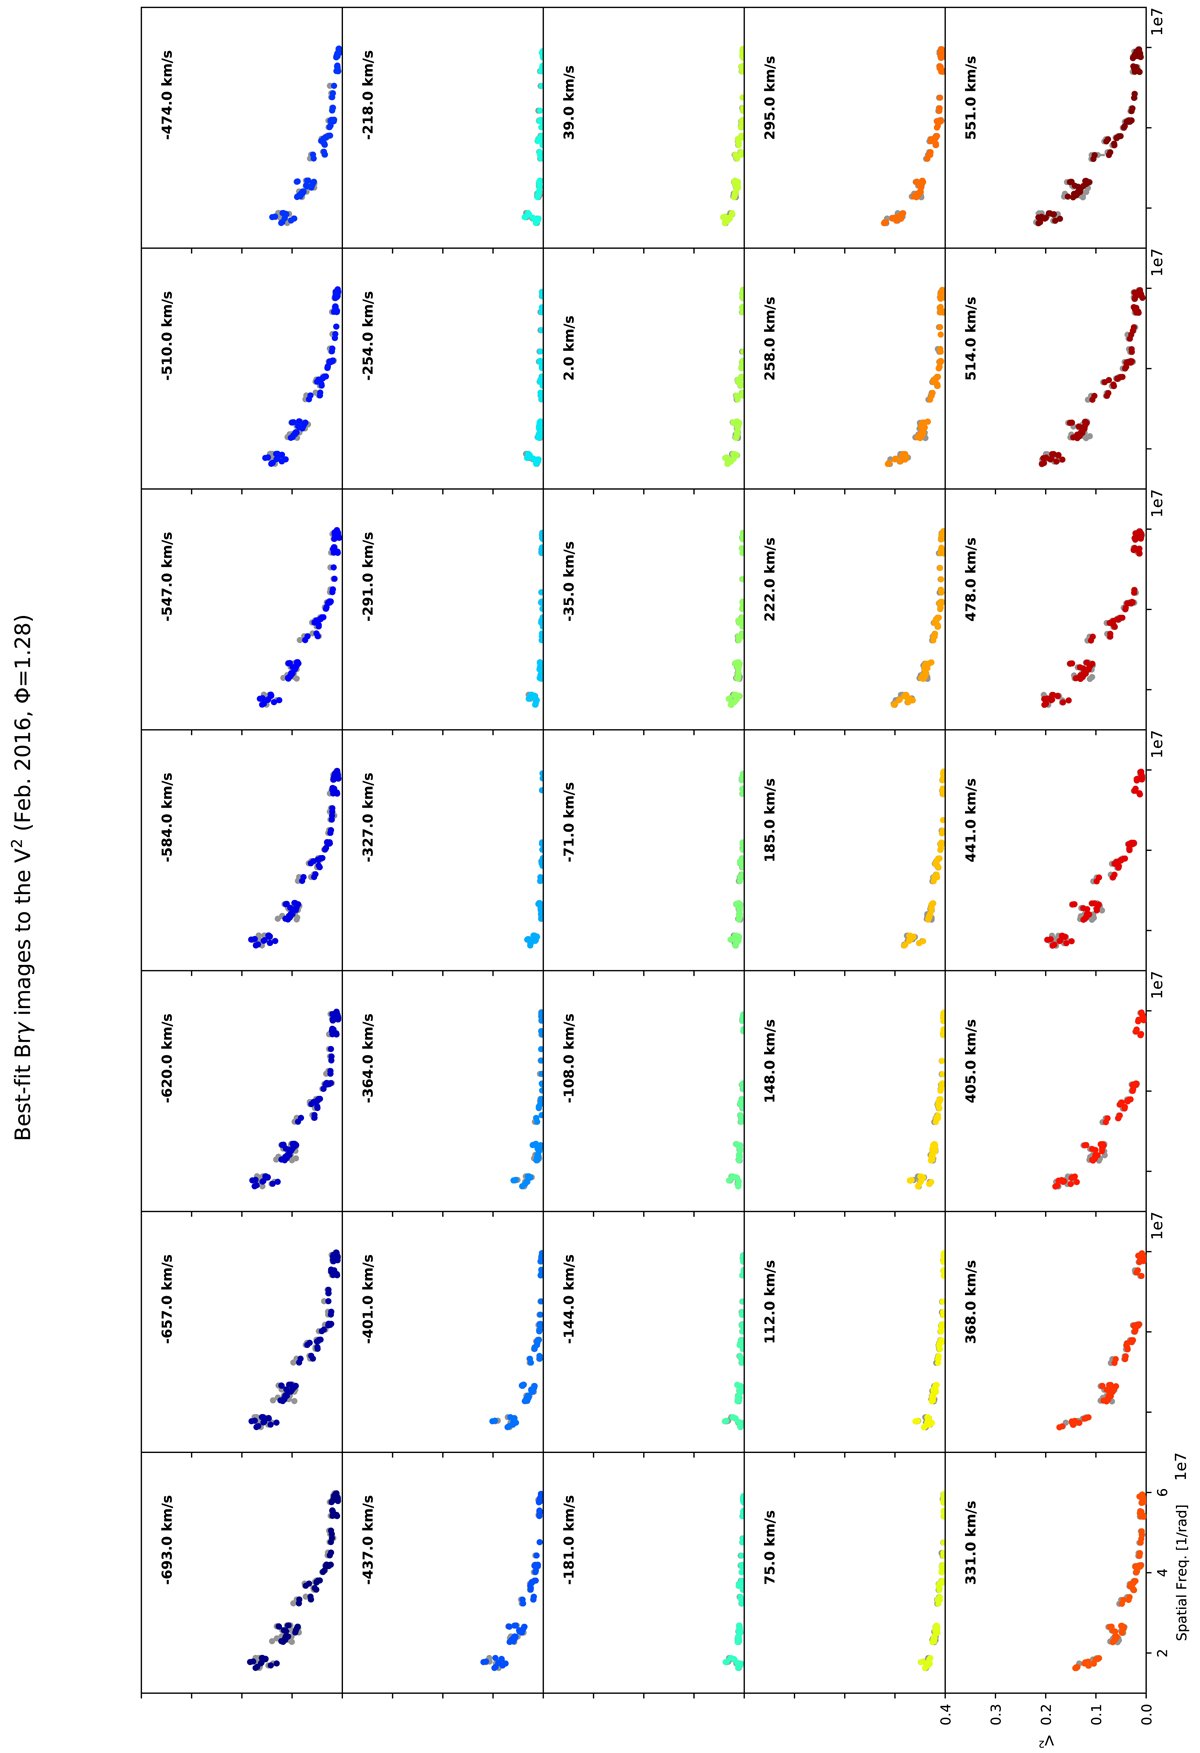
Fit to the observed V2 from the interferometric aperture synthesis images across the Brγ line (2016). The colored dots correspond to the synthetic V2 extracted from the unconvolved reconstructed images, while the observational data are represented with gray dots with 1σ error-bars. The Doppler velocity is labeled in each panel. All the panels share the same horizontal and vertical scales.
Current usage metrics show cumulative count of Article Views (full-text article views including HTML views, PDF and ePub downloads, according to the available data) and Abstracts Views on Vision4Press platform.
Data correspond to usage on the plateform after 2015. The current usage metrics is available 48-96 hours after online publication and is updated daily on week days.
Initial download of the metrics may take a while.