Fig. B.1.
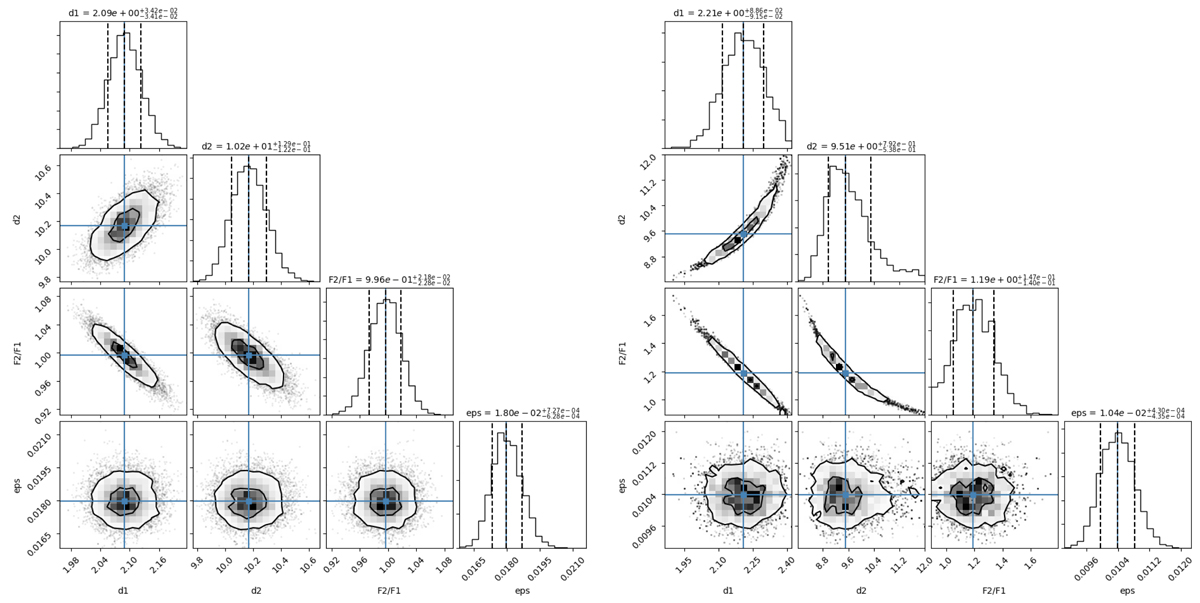
Posterior distributions of the best-fit parameters of the geometrical model presented in Sect. 3.1. Left panel: posterior distributions for the model applied to the V2 data at PA⊥ = 40° ± 20°, while the right panel displays the posterior distributions for the model at PA∥ = 130° ± 20°. The 2D distributions show 1 and 2 standard deviations encircled with a black contour. The mean of each distribution is displayed with a blue square. The 1D histograms show the expected value (mean) and ±1σ with vertical dashed lines, together with their corresponding values at the top.
Current usage metrics show cumulative count of Article Views (full-text article views including HTML views, PDF and ePub downloads, according to the available data) and Abstracts Views on Vision4Press platform.
Data correspond to usage on the plateform after 2015. The current usage metrics is available 48-96 hours after online publication and is updated daily on week days.
Initial download of the metrics may take a while.