Free Access
Fig. 13.
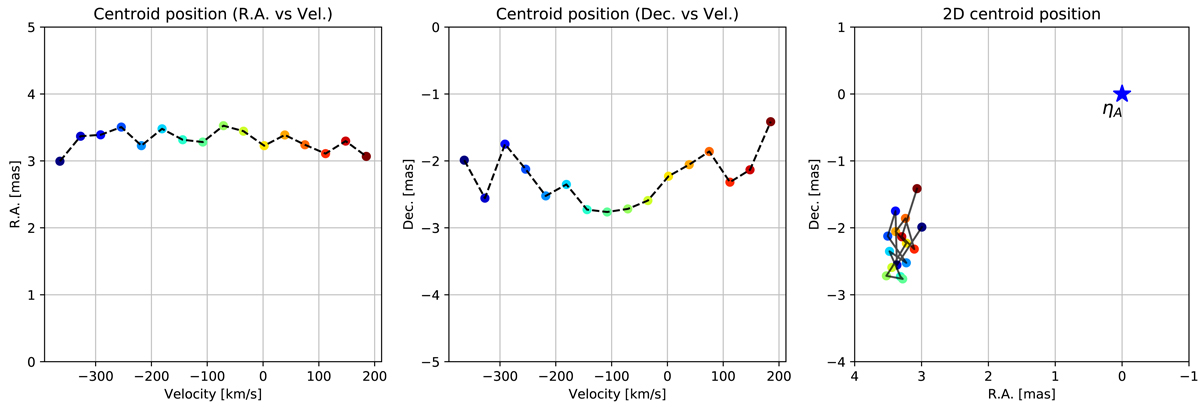
The image displays the centroid position of the 2016 arc-like feature vs. velocity. Left panel: centroid changes in RA vs. velocity. Middle panel: centroid changes in Dec vs. velocity. Right panel: 2D centroid position relative to the ηA’s continuum marked at origin with a blue star.
Current usage metrics show cumulative count of Article Views (full-text article views including HTML views, PDF and ePub downloads, according to the available data) and Abstracts Views on Vision4Press platform.
Data correspond to usage on the plateform after 2015. The current usage metrics is available 48-96 hours after online publication and is updated daily on week days.
Initial download of the metrics may take a while.