Fig. 12.
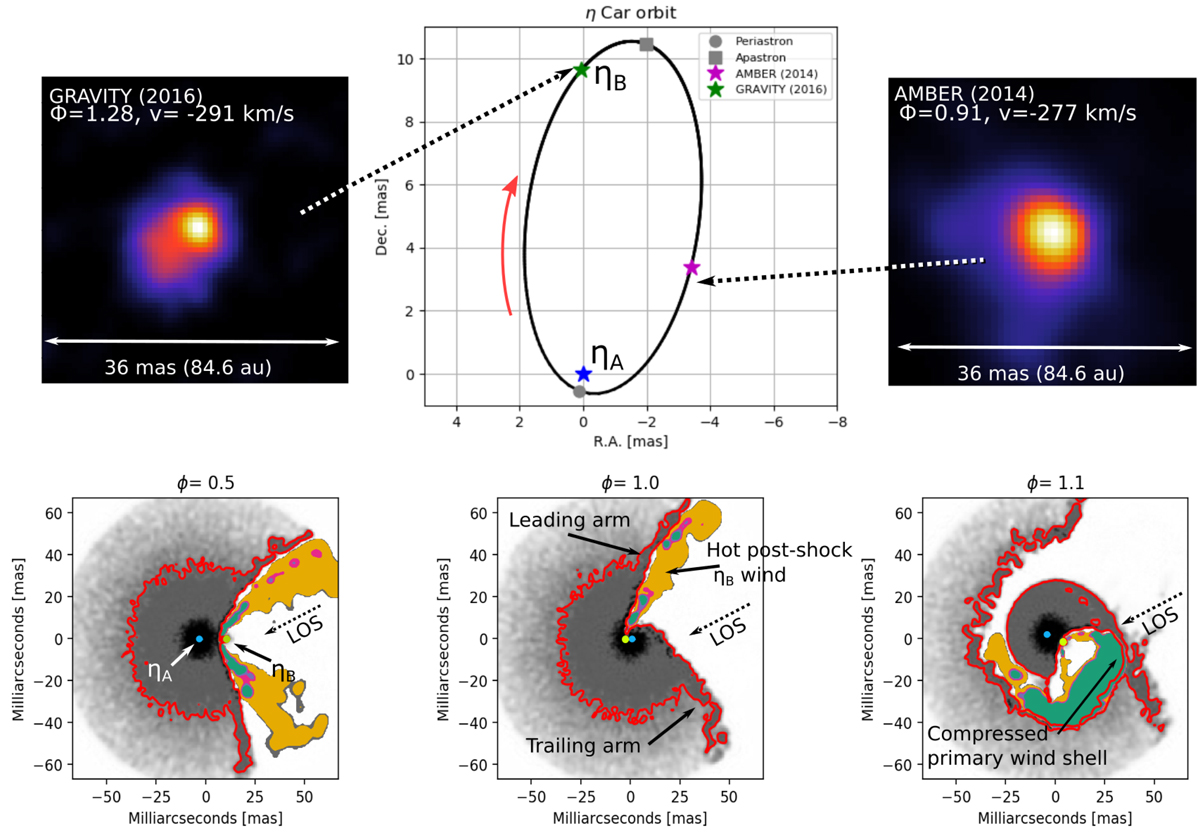
Upper-middle panel: projected orbit of ηB around ηA, with the position of the periastron, apastron, and two imaging epochs labeled on it. Upper-right panel: AMBER map at −277 km s−1, where the fan-shaped SE morphology is observed at ϕ∼ 0.91. Upper-left panel: GRAVITY image at −291 km s−1, the SE arc-like feature is observed at ϕ ∼ 1.28. The FOV of the images is of 36 mas, and they are oriented with the east pointing toward the left and the north toward the top of frames. Lowermost panels: three orbital phases, ϕ = 0.5 (lower-left), ϕ = 1.0 (lower-middle) and ϕ = 1.1 (lower-right), of the wind-wind collision model created by Madura et al. (2013). The panels show the structure of the wind-wind cavity in the orbital plane. The red lines indicate the contour where the density is 10−16 g cm−3 and they highlight the changes in the leading and trailing arms of the wind-wind cavity. The positions of the primary and secondary for each phase are marked on the panels with blue and green dots, respectively. The green, magenta, and yellow areas trace the hot (T ∼ 106 − 108 K) post-shock secondary wind bordering the cavity shells. The vector of the observer’s line-of-sight is labeled on each panel, and it corresponds to ω = 243° and ω = 47°. The principal components‘ of the wind-wind cavity are also indicated in the panels. The lowermost panels were taken from Madura et al. (2013) and adapted to the discussion presented in Sect. 4.3.
Current usage metrics show cumulative count of Article Views (full-text article views including HTML views, PDF and ePub downloads, according to the available data) and Abstracts Views on Vision4Press platform.
Data correspond to usage on the plateform after 2015. The current usage metrics is available 48-96 hours after online publication and is updated daily on week days.
Initial download of the metrics may take a while.