Free Access
Fig. 2.
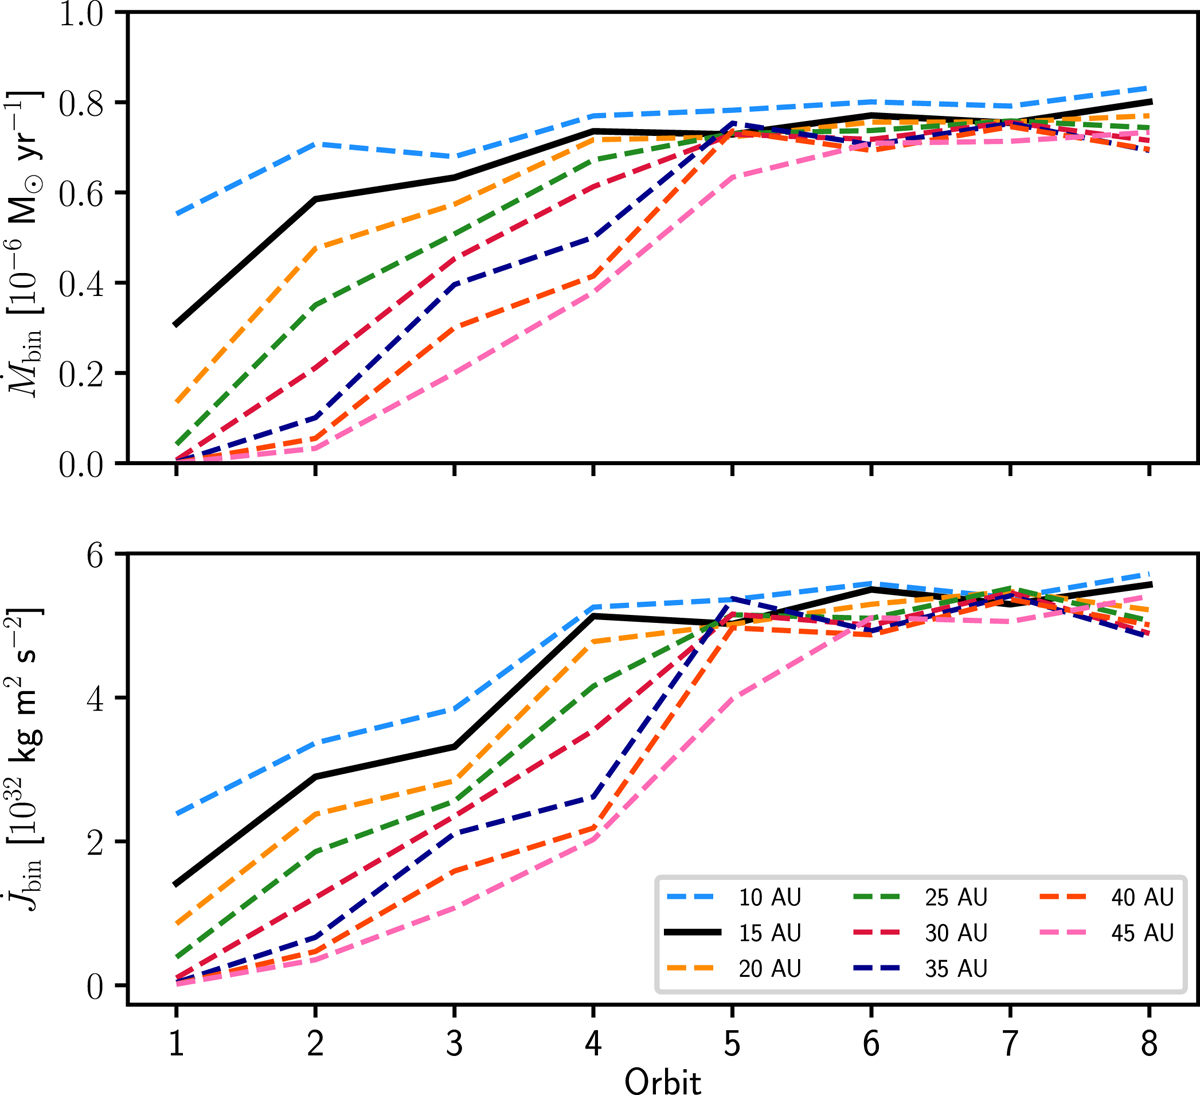
Top: average mass loss per orbit for the standard model V15a5 measured at different radii from the centre of mass of the binary as indicated by different colours. Bottom: corresponding angular-momentum loss. The black thick curve for rS = 15 AU corresponds to the radius at which we measure J̇bin.
Current usage metrics show cumulative count of Article Views (full-text article views including HTML views, PDF and ePub downloads, according to the available data) and Abstracts Views on Vision4Press platform.
Data correspond to usage on the plateform after 2015. The current usage metrics is available 48-96 hours after online publication and is updated daily on week days.
Initial download of the metrics may take a while.