Fig. 10.
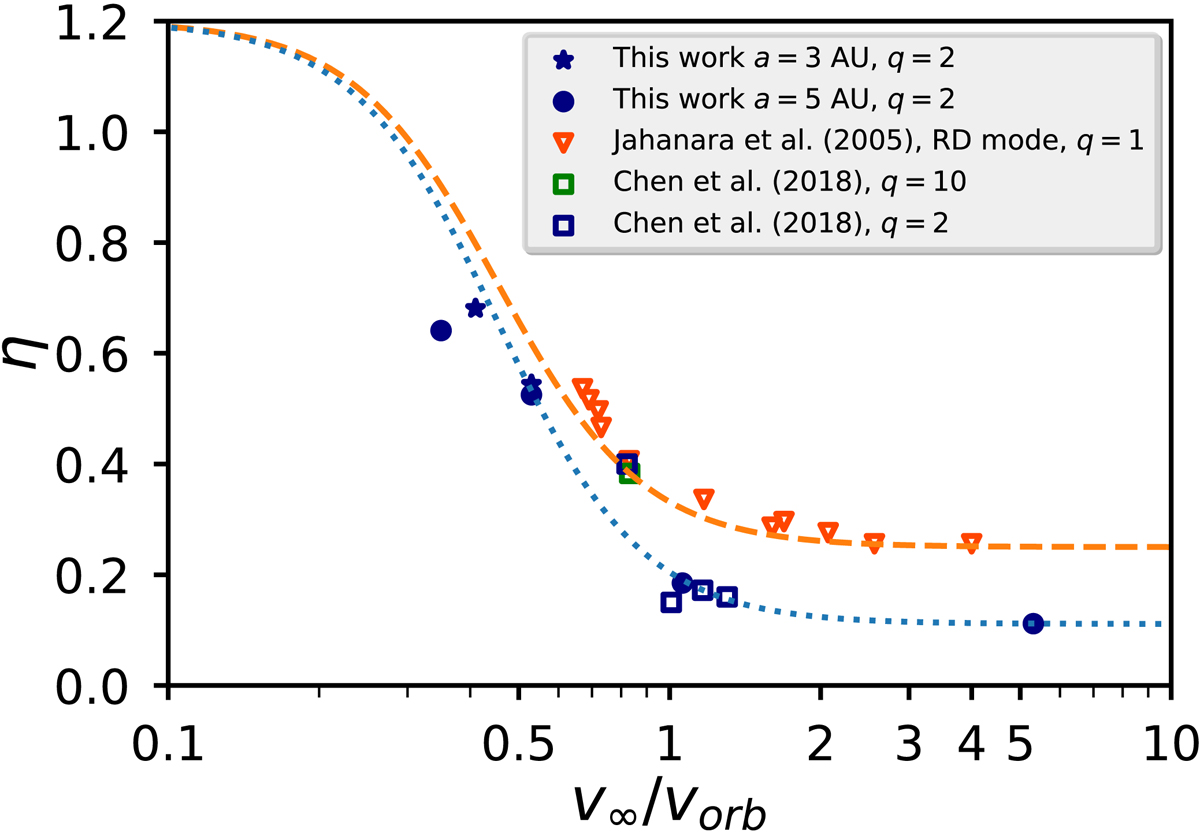
Comparison of our results (Fig. 9) to other work. The data points correspond to the specific orbital angular momentum lost from the system via winds obtained using different methods. The open squares correspond to the results of Chen et al. (2018), triangles show the results of Jahanara et al. (2005) for the radiatively driven wind mode. In the latter case we have interpreted the wind velocity at the Roche-lobe surface as corresponding to v∞. The results from both papers have been corrected for the spin angular-momentum loss (see text) to compare with our results. The colours correspond to different mass ratios q and the lines to the fit formula described by Eq. (13). The blue dotted line is the fit for q = 2, and the orange dashed line for q = 1.
Current usage metrics show cumulative count of Article Views (full-text article views including HTML views, PDF and ePub downloads, according to the available data) and Abstracts Views on Vision4Press platform.
Data correspond to usage on the plateform after 2015. The current usage metrics is available 48-96 hours after online publication and is updated daily on week days.
Initial download of the metrics may take a while.