Fig. 9.
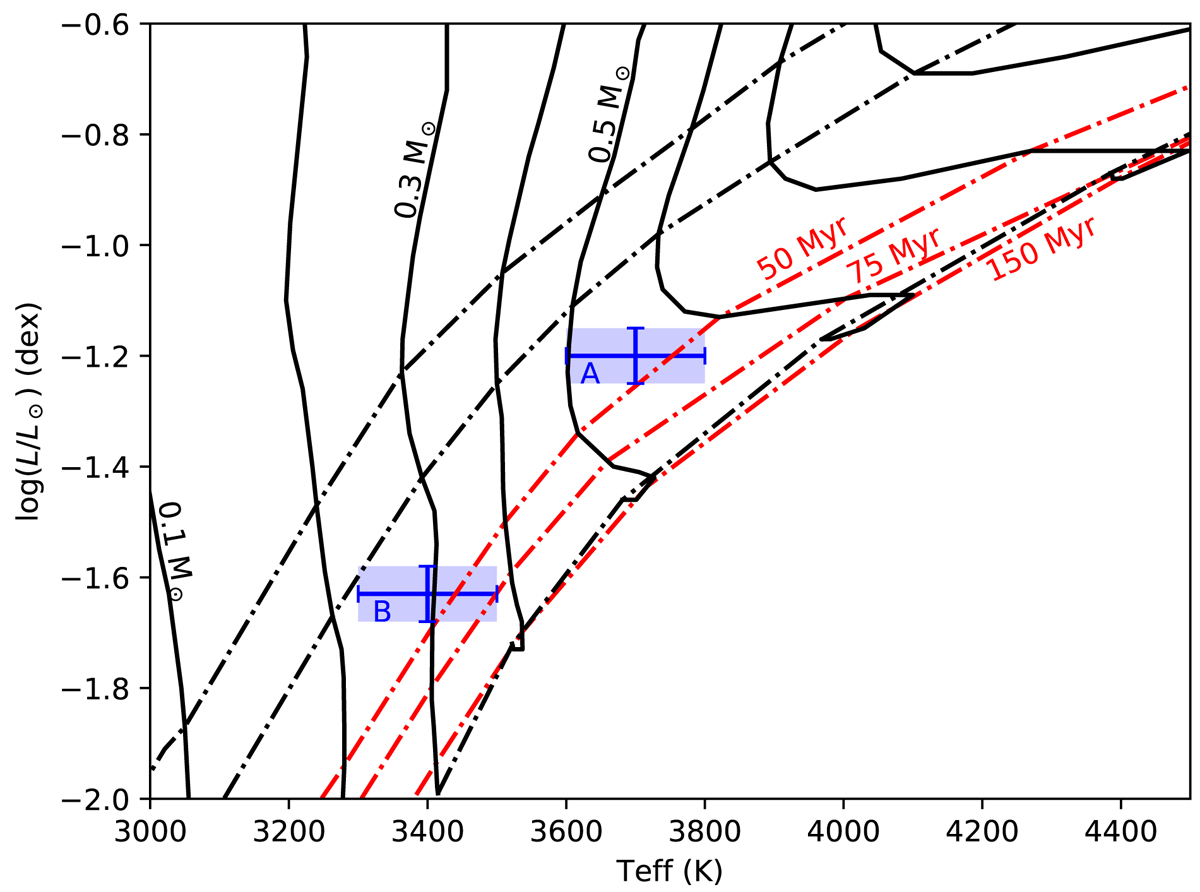
Isochrones and iso-mass curves predicted by BHAC15. Shown are the 10, 20, 50, 75, 150, and 600 Myr isochrones (dash-dotted lines from left to right), while one iso-mass is drawn as a solid line every 0.1 M⊙ from 0.1 (left) to 1 M⊙ (right). The 50, 75, and 150 Myr isochrones correspond to possible ages for AB Dor-MG, and are drawn in red. The blue shaded areas correspond to the observed values and their error bars for each component of system GJ 2060, A and B.
Current usage metrics show cumulative count of Article Views (full-text article views including HTML views, PDF and ePub downloads, according to the available data) and Abstracts Views on Vision4Press platform.
Data correspond to usage on the plateform after 2015. The current usage metrics is available 48-96 hours after online publication and is updated daily on week days.
Initial download of the metrics may take a while.