Free Access
Fig. 4.
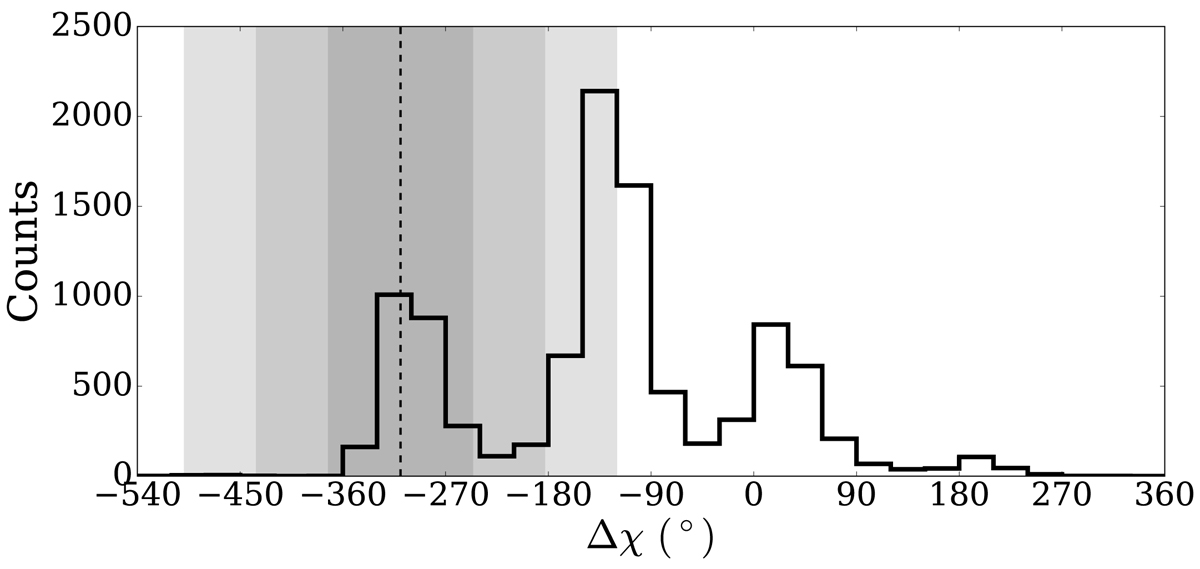
J1505+0326: Distribution of Δχ in simulated EVPA curves. The grey areas mark the 1, 2, and 3σ intervals, while the dashed line is the observed rotation of 309.5°. The most probable value (peak of the solid distribution) is at about −140 deg.
Current usage metrics show cumulative count of Article Views (full-text article views including HTML views, PDF and ePub downloads, according to the available data) and Abstracts Views on Vision4Press platform.
Data correspond to usage on the plateform after 2015. The current usage metrics is available 48-96 hours after online publication and is updated daily on week days.
Initial download of the metrics may take a while.