Fig. 16.
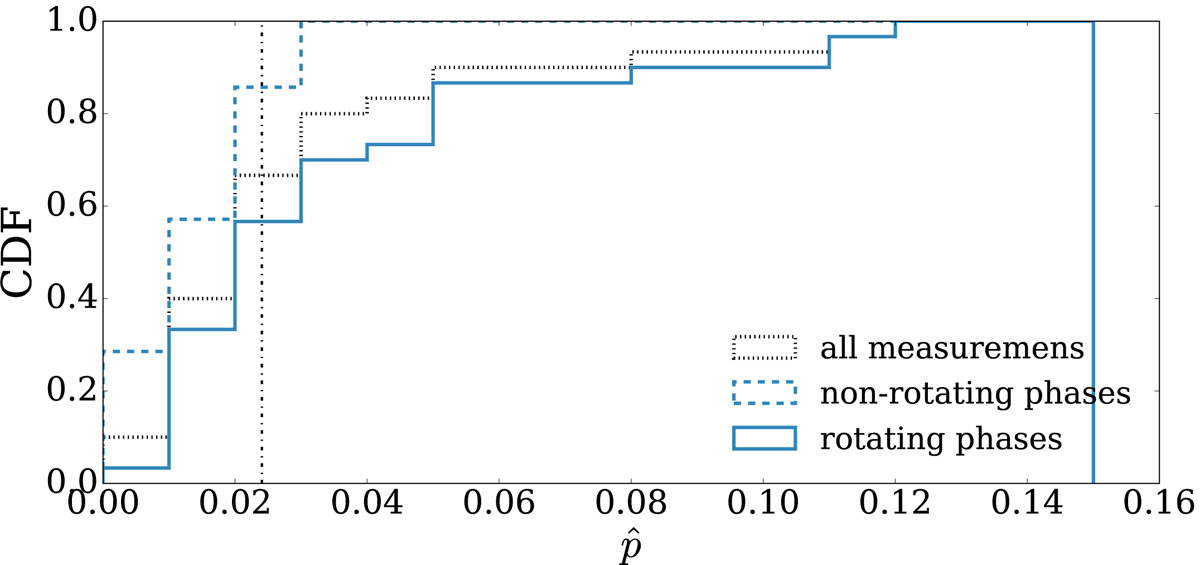
J0948+0022: Distribution of the debiased polarisation fraction p̂. The dot-dashed vertical line marks the median of the distribution. The blue dashed line shows the distribution of p̂ during the non-rotating phases, and the solid line shows this during the rotating phases. The black dotted line corresponds to all the measurements.
Current usage metrics show cumulative count of Article Views (full-text article views including HTML views, PDF and ePub downloads, according to the available data) and Abstracts Views on Vision4Press platform.
Data correspond to usage on the plateform after 2015. The current usage metrics is available 48-96 hours after online publication and is updated daily on week days.
Initial download of the metrics may take a while.