Fig. 1.
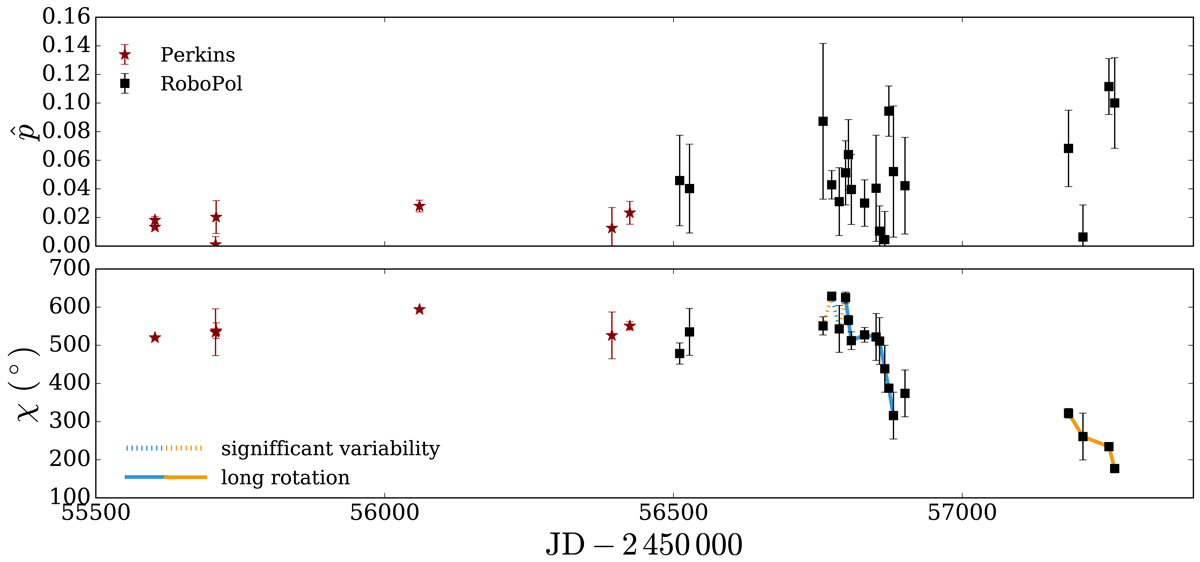
J1505+0326: Debiased polarisation fraction p and adjusted EVPA (χ) as a function of time. The coloured lines mark periods of significant monotonous (within the uncertainties) EVPA evolution. Solid lines mark periods of long rotations (i.e. at least three sequential data points and an angle larger than 90°). Blue and orange connecting lines are used alternately for clarity.
Current usage metrics show cumulative count of Article Views (full-text article views including HTML views, PDF and ePub downloads, according to the available data) and Abstracts Views on Vision4Press platform.
Data correspond to usage on the plateform after 2015. The current usage metrics is available 48-96 hours after online publication and is updated daily on week days.
Initial download of the metrics may take a while.