Fig. 7.
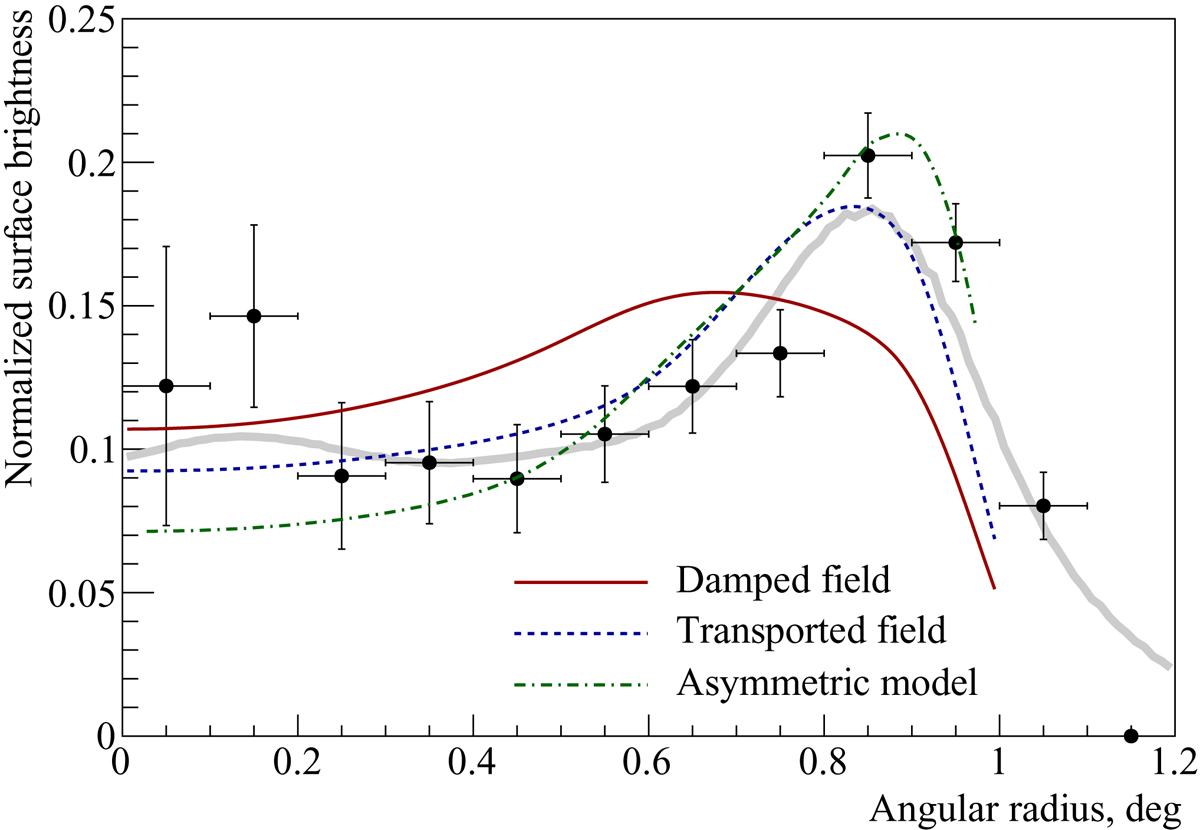
Simulated radial surface brightness profiles of the gamma-ray emission in the 300 GeV−20 TeV energy range compared to the H.E.S.S. measurements for the northern part of the remnant (Aharonian et al. 2007, black filled circles). Red solid and blue dashed lines show simulated profiles for the spherically symmetric models BOHM_DAMP and BOHM_KOLM, respectively. The radial profile obtained within the asymmetric model discussed in Sect. 4.2 is represented by the green dash-dotted line. This profile is averaged over the azimuth angle for the hemisphere containing the cone of enhanced emission. The thick gray line shows the azimuthally averaged radial profile for the northern part of the SNR extracted from the recently published updated H.E.S.S. excess skymap (H.E.S.S. Collaboration 2018). This skymap is smoothed with a Gaussian function of width 0.08◦. All simulated profiles are normalized in the same way as H.E.S.S. measurements in Aharonian et al. (2007).
Current usage metrics show cumulative count of Article Views (full-text article views including HTML views, PDF and ePub downloads, according to the available data) and Abstracts Views on Vision4Press platform.
Data correspond to usage on the plateform after 2015. The current usage metrics is available 48-96 hours after online publication and is updated daily on week days.
Initial download of the metrics may take a while.