Fig. 6.
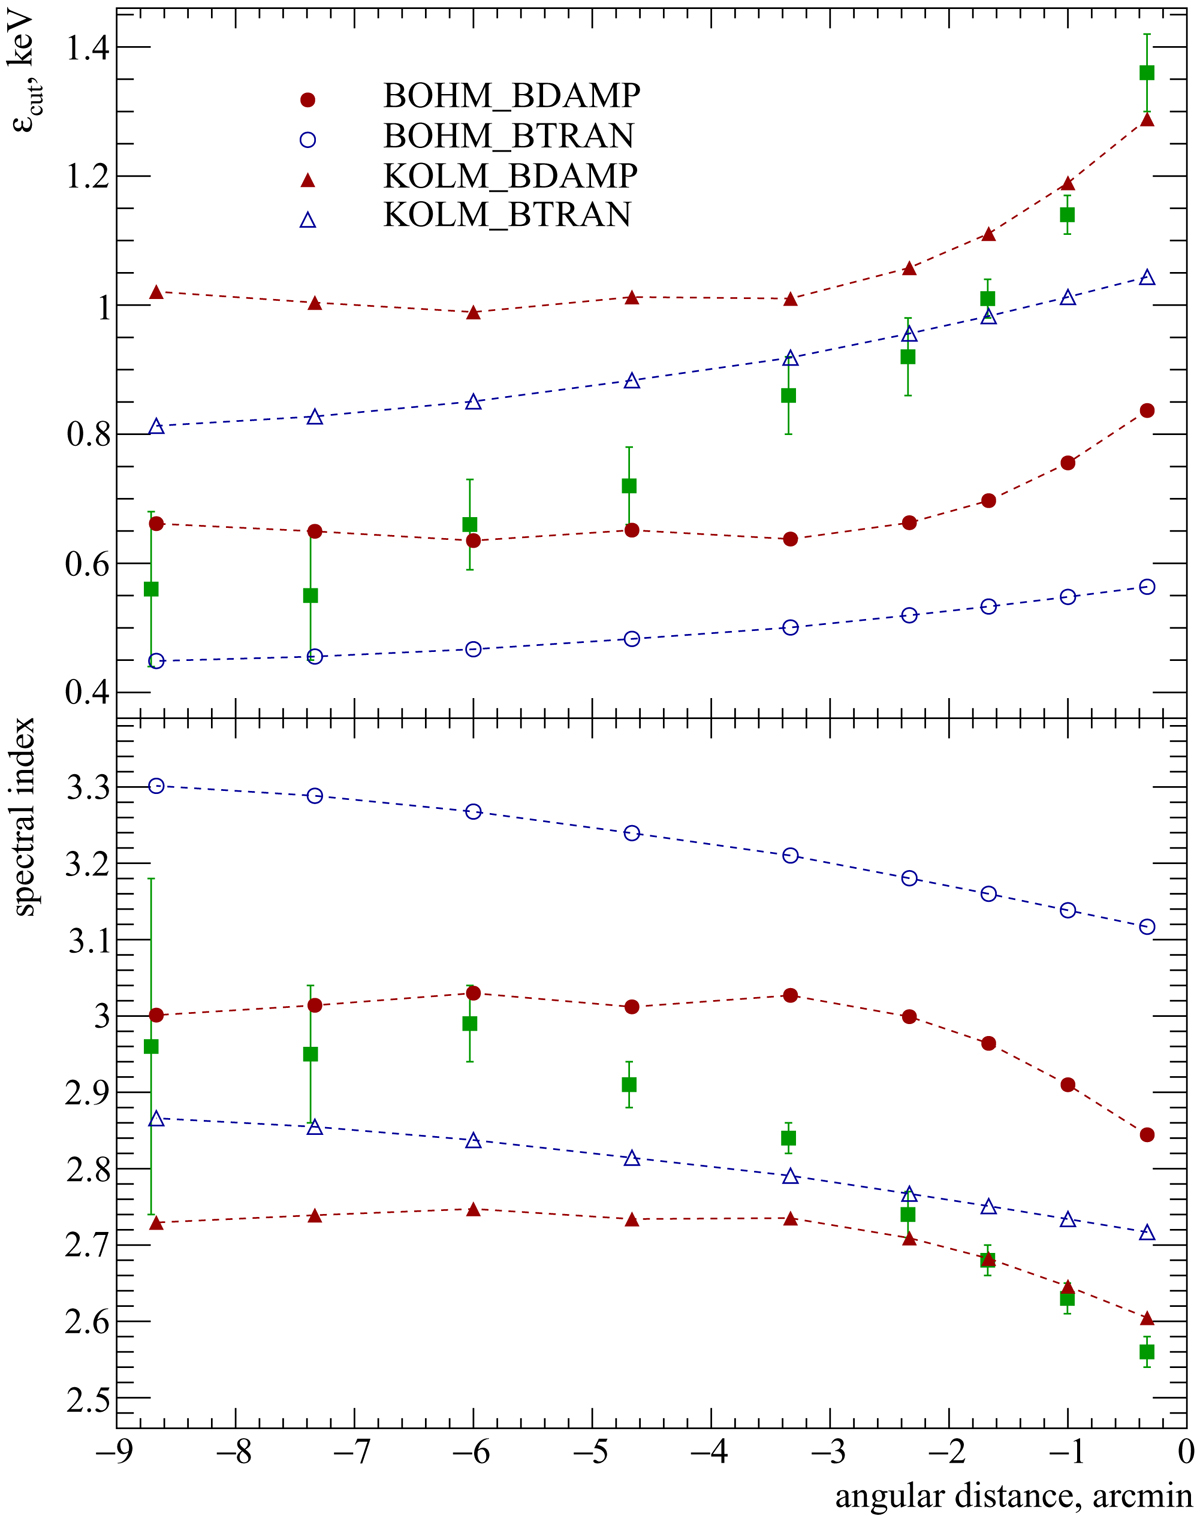
Simulated projected radial profiles of the X-ray spectral parameters for four different models assuming spherical symmetry. Top panel: cut-off energy and the bottom one shows the spectral index in the 2−10 keV band as a function of the angular distance from the forward shock of the SNR. The distributions are obtained by extracting the spectrum for each region and fitting it with an exponential cut-off power law assuming a photon spectral index of Γ = 1.6(top panel) and with a simple power law (bottom panel). In both panels, green squares indicate the observational data (Kishishita et al. 2013).
Current usage metrics show cumulative count of Article Views (full-text article views including HTML views, PDF and ePub downloads, according to the available data) and Abstracts Views on Vision4Press platform.
Data correspond to usage on the plateform after 2015. The current usage metrics is available 48-96 hours after online publication and is updated daily on week days.
Initial download of the metrics may take a while.