Fig. 3.
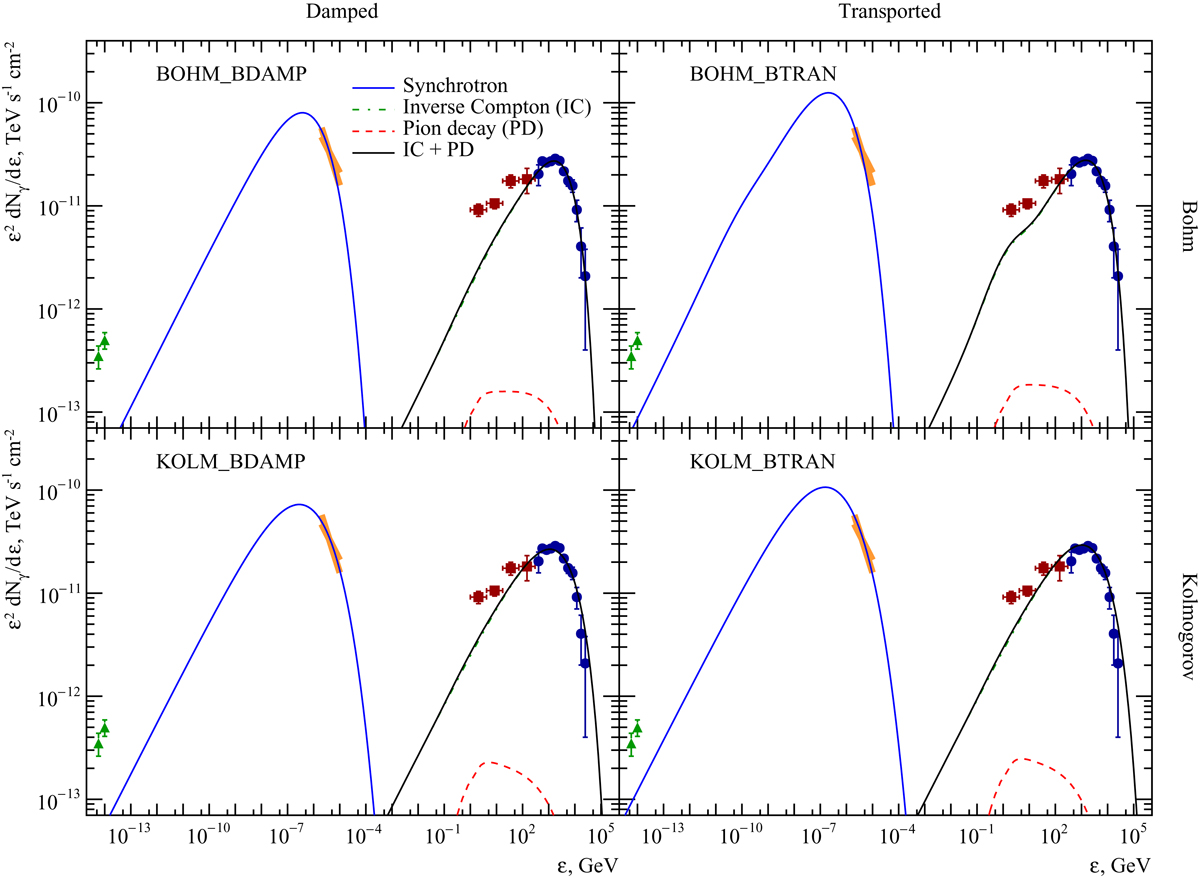
SED of the Vela Jr. SNR. Lines represent simulated emission from the source produced in different processes as specified in the legend in the magnetic field damping model (left panels) and synchrotron cooling model (right panels). Green triangles indicate the observed radio emission as detected by Parkes (Duncan & Green 2000), an orange bow-tie shows the spectral fit of the X-ray XMM-Newton data (Aharonian et al. 2007), red squares represent the Fermi-LAT data points (Tanaka et al. 2011) and blue circles show the H.E.S.S. data points (H.E.S.S. Collaboration 2018).
Current usage metrics show cumulative count of Article Views (full-text article views including HTML views, PDF and ePub downloads, according to the available data) and Abstracts Views on Vision4Press platform.
Data correspond to usage on the plateform after 2015. The current usage metrics is available 48-96 hours after online publication and is updated daily on week days.
Initial download of the metrics may take a while.