Fig. 7.
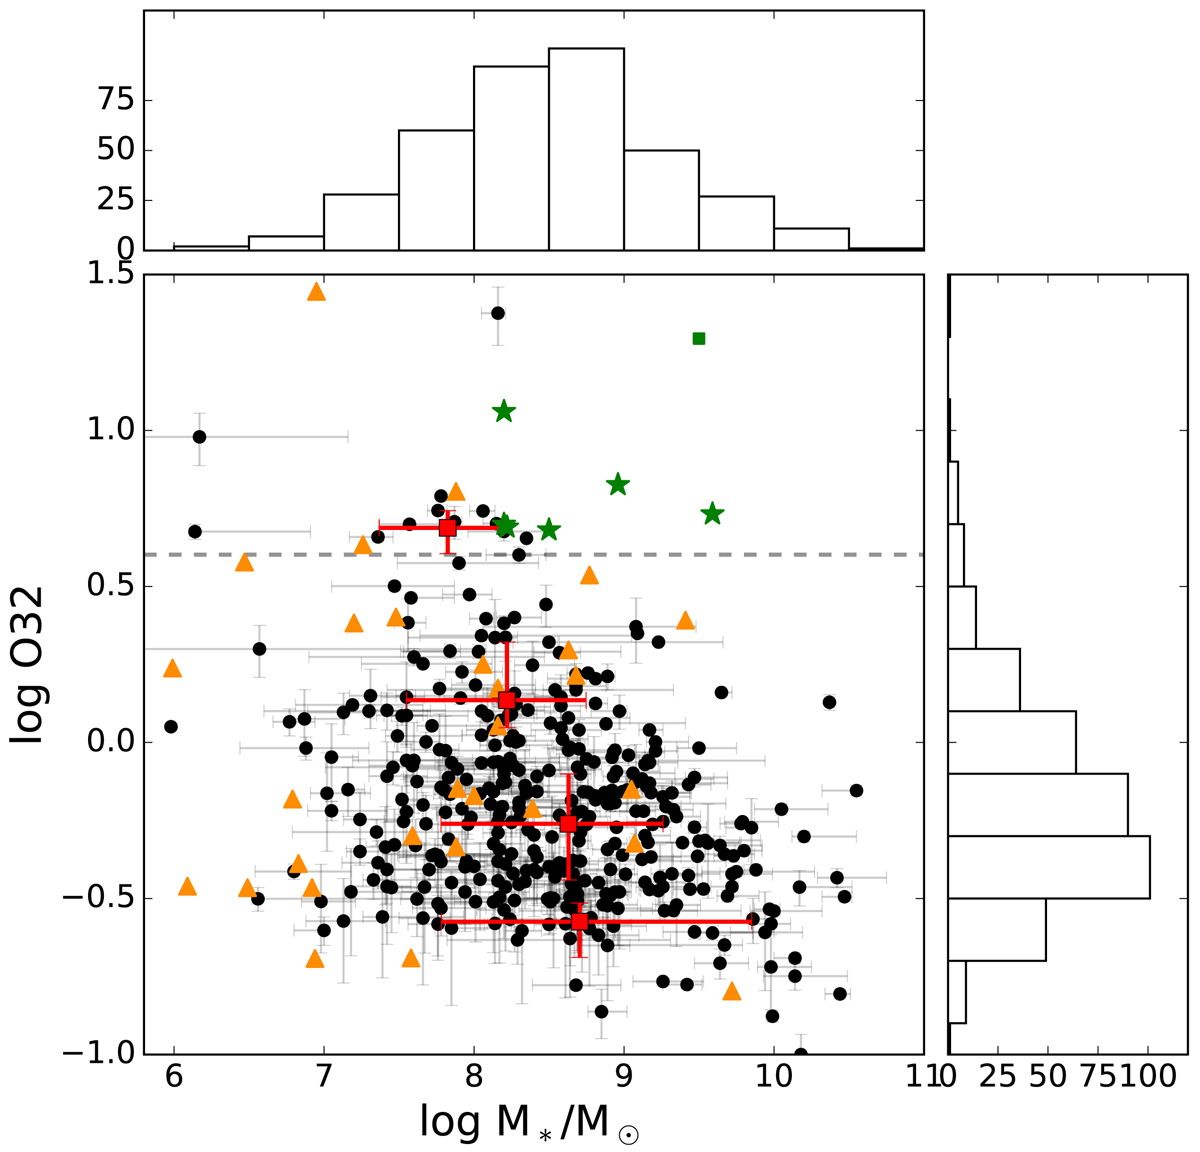
Stellar mass as a function of log O32 (black dots) and lower limits on O32 (orange triangles). The median per bin with 1-σ errors is shown by the red squares and error bars. We defined the bins by intervals of logO32 between −1.0 and 1.0 with a step size of 0.5. Three-σ lower limits on the O32 ratio for sources with a detection of [O II] below our S/N cut are shown by the orange triangles. The green stars indicate the positions of the confirmed Lyman continuum leakers from Izotov et al. (2016a,b, a) and the green square is a LyC emitter at z = 3.2 (de Barros et al. 2016; Vanzella et al. 2016). Galaxies above the grey dashed line have extreme O32 ratios (O32 > 4).
Current usage metrics show cumulative count of Article Views (full-text article views including HTML views, PDF and ePub downloads, according to the available data) and Abstracts Views on Vision4Press platform.
Data correspond to usage on the plateform after 2015. The current usage metrics is available 48-96 hours after online publication and is updated daily on week days.
Initial download of the metrics may take a while.