Fig. 5.
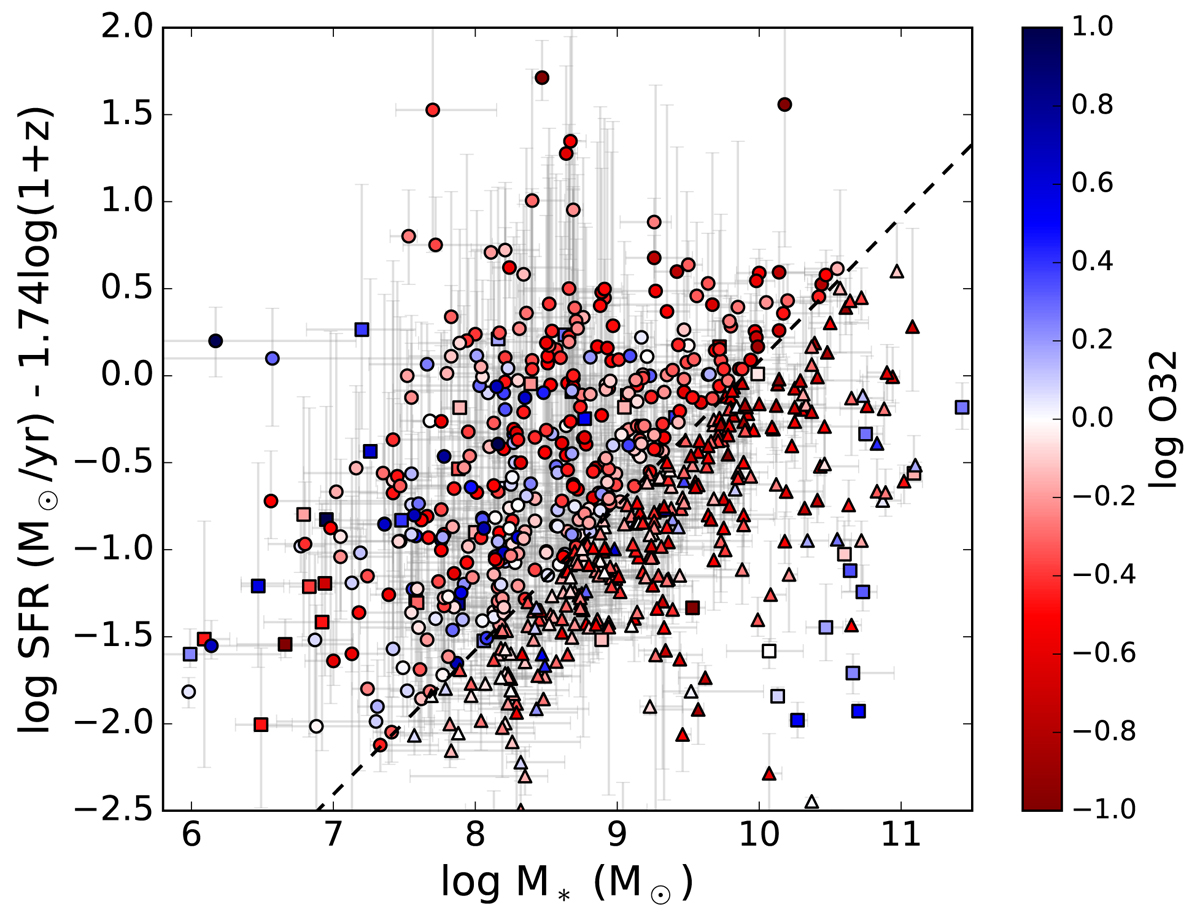
SFR−M∗ diagram where we have corrected the SFRs to z = 0 using the redshift evolution from Eq. (1). The dashed line shows this relation for z = 0, above which we selected galaxies in our sample, as described in Sect. 2.6. The points are coloured by the logarithm of the dust-corrected O32 ratio. The symbols show galaxies in the final selection (circles), galaxies below the selection threshold (triangles), and galaxies with a lower limit on the O32 ratio (squares).
Current usage metrics show cumulative count of Article Views (full-text article views including HTML views, PDF and ePub downloads, according to the available data) and Abstracts Views on Vision4Press platform.
Data correspond to usage on the plateform after 2015. The current usage metrics is available 48-96 hours after online publication and is updated daily on week days.
Initial download of the metrics may take a while.