Fig. 3.
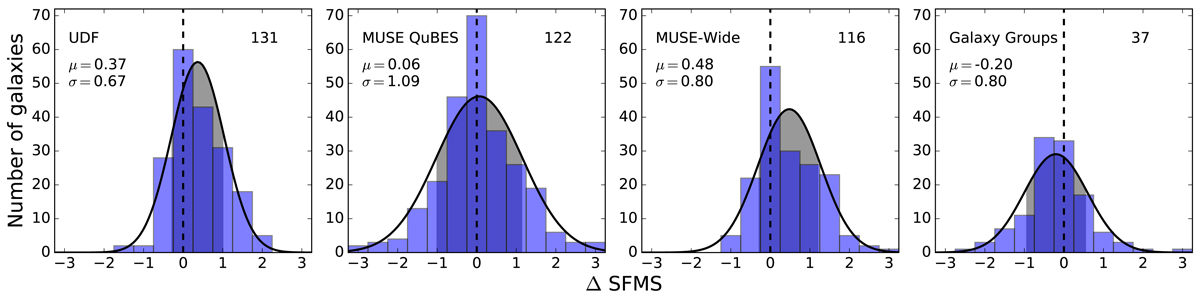
Distribution of the distance to the redshift-dependent SFMS from (Boogaard et al. 2018, Eq. (1)) in dex of the four different surveys used for this study. We show the 1-σ variation around the mean μ (grey area) calculated from the fitted normal distribution (black line). We included all galaxies with a distance > 0 dex (dashed line), so all galaxies that lie above the main sequence. The number in the upper right corner of the diagram shows the number of galaxies above this threshold. In our final sample we include 406 galaxies in total.
Current usage metrics show cumulative count of Article Views (full-text article views including HTML views, PDF and ePub downloads, according to the available data) and Abstracts Views on Vision4Press platform.
Data correspond to usage on the plateform after 2015. The current usage metrics is available 48-96 hours after online publication and is updated daily on week days.
Initial download of the metrics may take a while.