Fig. B.2.
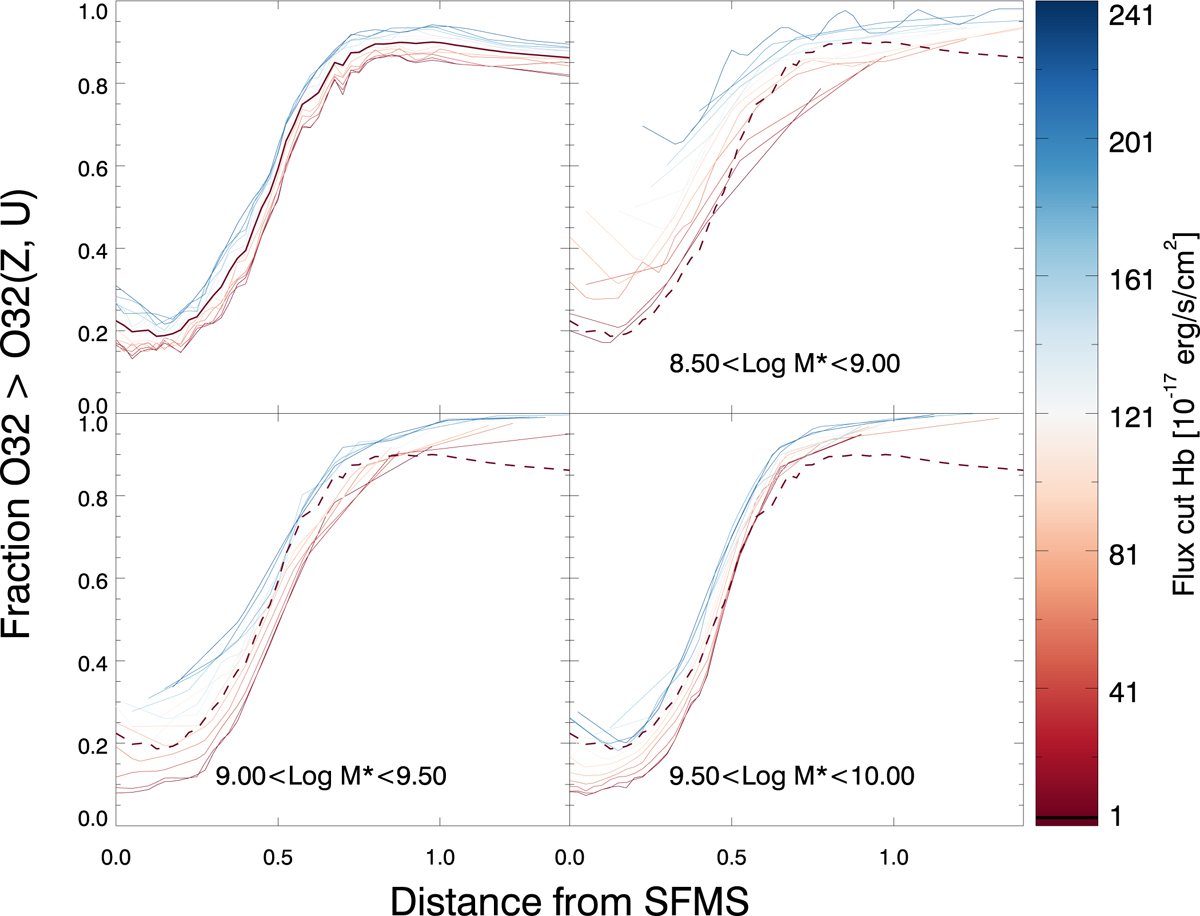
Fraction of O32 above the metallicity-dependent threshold for high O32 emitters versus the distance to the SFMS. The colours are used in the same way as in the previous figure. The upper panel shows the entire SDSS sample, the other panels for a M∗ range are specified in green. The median of the fraction of the entire sample from the upper left panel is presented by the black dashed line.
Current usage metrics show cumulative count of Article Views (full-text article views including HTML views, PDF and ePub downloads, according to the available data) and Abstracts Views on Vision4Press platform.
Data correspond to usage on the plateform after 2015. The current usage metrics is available 48-96 hours after online publication and is updated daily on week days.
Initial download of the metrics may take a while.