Free Access
Fig. 19.
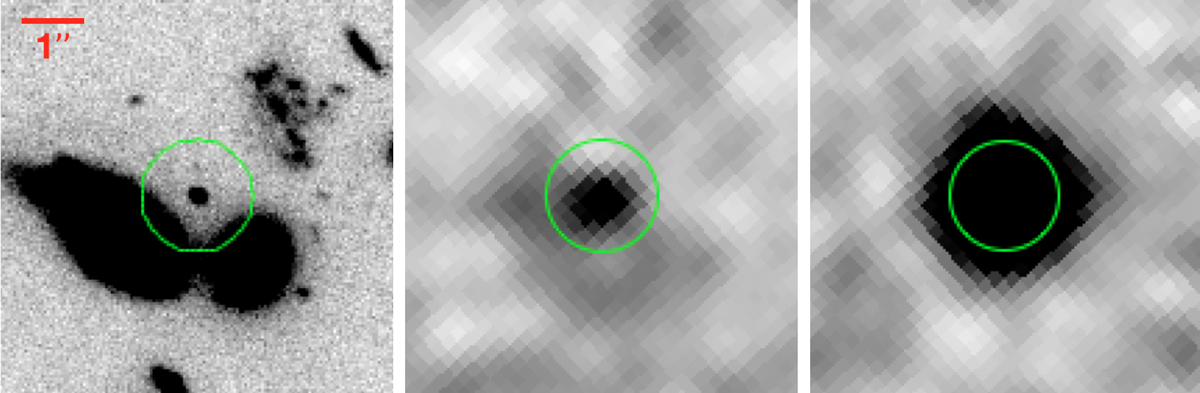
HST F77W image (left), a MUSE narrow band image of the [O II]λ3727 line (middle), and a MUSE narrow band image of the [O III]λ5007 line (right) of the most extreme oxygen emitter with O32 = 23.
Current usage metrics show cumulative count of Article Views (full-text article views including HTML views, PDF and ePub downloads, according to the available data) and Abstracts Views on Vision4Press platform.
Data correspond to usage on the plateform after 2015. The current usage metrics is available 48-96 hours after online publication and is updated daily on week days.
Initial download of the metrics may take a while.