Fig. 18.
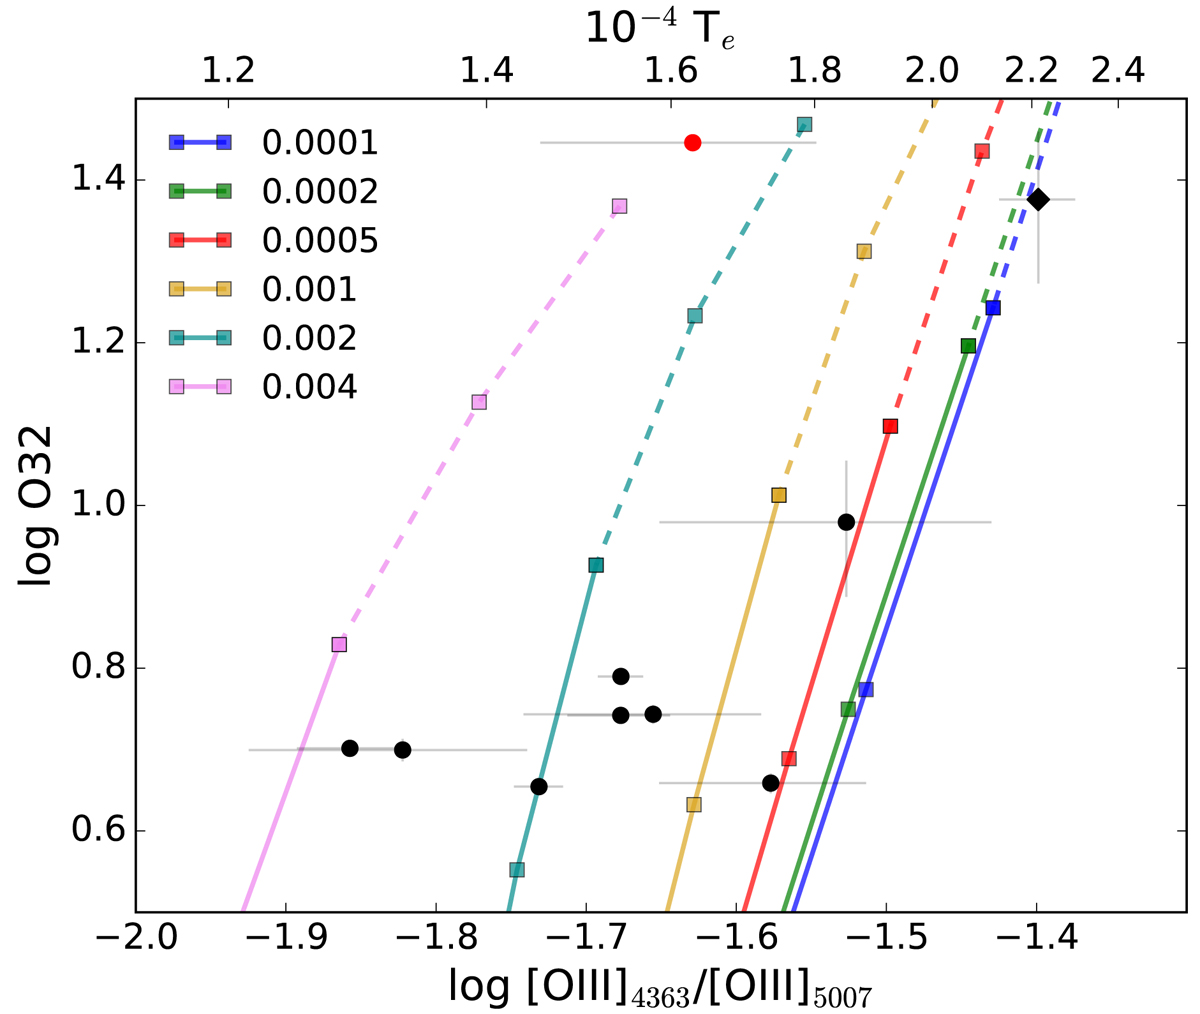
Log O32 versus the [O III]λ4363/[O III]λ5007 ratio (lower x-axis) and the electron temperature in the [O III] regime (lower x-axis) calculated using the nebular.ionic routine in Pyneb (Luridiana et al. 2015), assuming ne = 100 cm3. The coloured lines indicate the predictions from the Gutkin et al. (2016) models of different metallicity as indicated by the colours, with increasing log U towards the upper right, and log U < −2 (solid line) and log U < −2 (dashed line), and step size of log U = 0.5 between the squares. The colours of the circles are used as in Fig. 17.
Current usage metrics show cumulative count of Article Views (full-text article views including HTML views, PDF and ePub downloads, according to the available data) and Abstracts Views on Vision4Press platform.
Data correspond to usage on the plateform after 2015. The current usage metrics is available 48-96 hours after online publication and is updated daily on week days.
Initial download of the metrics may take a while.