Fig. 17.
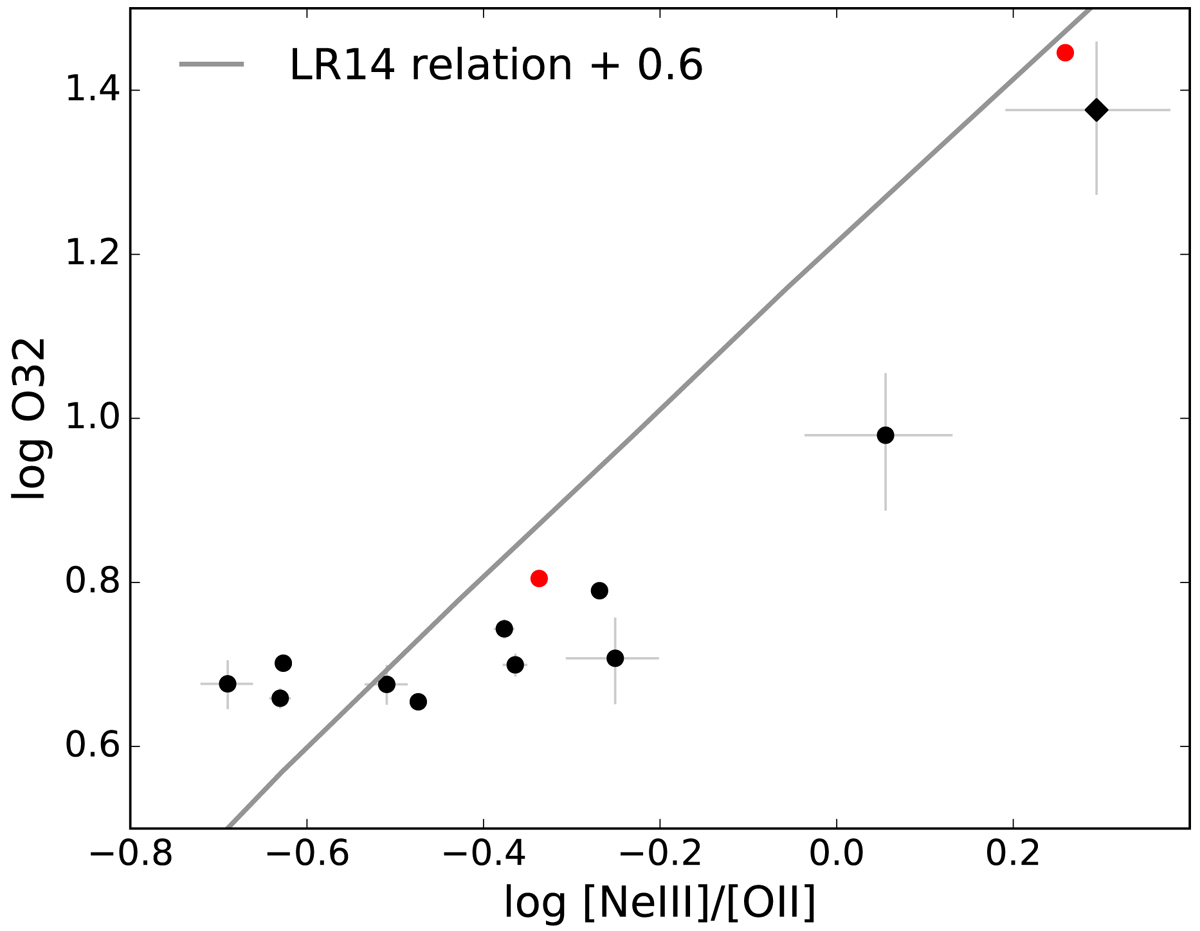
Log O32 versus the log [Ne III]λ3869/[O II] ratio for our extreme emitters (O32 > 4) with a [Ne III]λ3869 detection of at least 3σ. The galaxies of which we do not have a significant [O II] detection are presented by red circles, which are the 3-σ upper limits on both ratios. The rest of the extreme emitters sample is shown by black circles and the most extreme O32 emitter by the black diamond. The grey line corresponds to the Levesque & Richardson (2014) relation for Z = 0.2 Z⊙ between log O32 and log [Ne III]λ3869/[O II]which is offset by +0.6 in the y-direction.
Current usage metrics show cumulative count of Article Views (full-text article views including HTML views, PDF and ePub downloads, according to the available data) and Abstracts Views on Vision4Press platform.
Data correspond to usage on the plateform after 2015. The current usage metrics is available 48-96 hours after online publication and is updated daily on week days.
Initial download of the metrics may take a while.