Fig. 11.
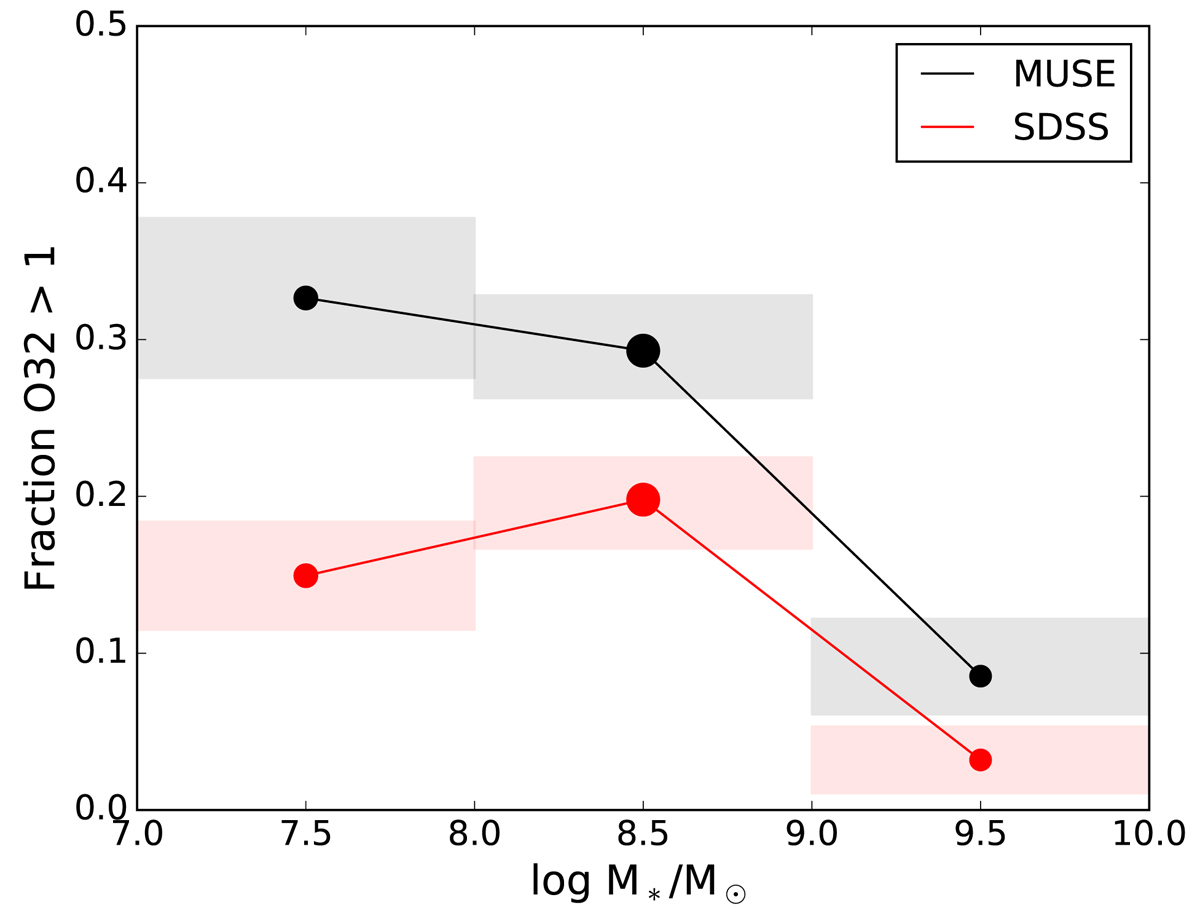
Fraction of galaxies with O32 > 1 in bins of 1 dex with central log M∗M⊙ = 7.5, 8.5, and 9.5 of our MUSE sample (black/grey) and the SDSS comparison sample (red; see the text for details). The points denote the centres of the stellar mass bins and their size reflects the number of galaxies in the bin. The shaded areas cover the 1-σ errors as calculated by bootstrapping in the y-direction and the bin size in the x-direction.
Current usage metrics show cumulative count of Article Views (full-text article views including HTML views, PDF and ePub downloads, according to the available data) and Abstracts Views on Vision4Press platform.
Data correspond to usage on the plateform after 2015. The current usage metrics is available 48-96 hours after online publication and is updated daily on week days.
Initial download of the metrics may take a while.