Fig. 10.
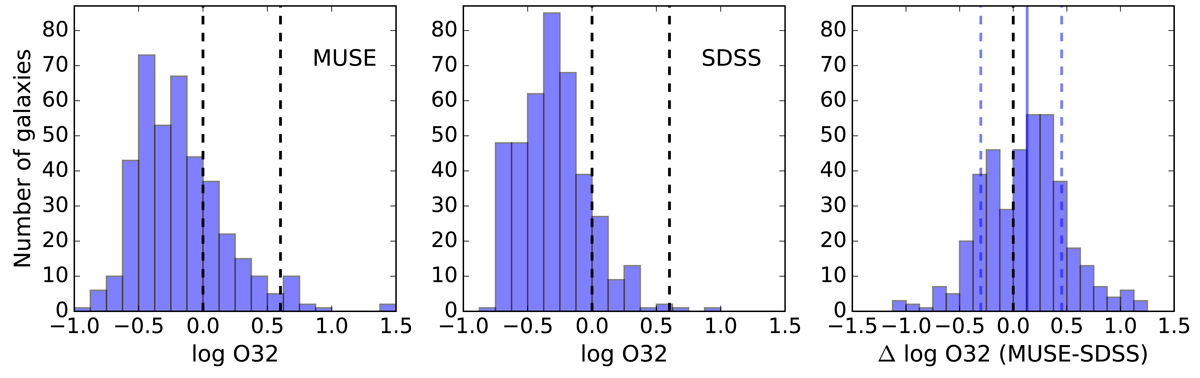
Number of galaxies per log O32 bin for our sample of 406 galaxies (left panel). The dashed lines correspond to O32 = 1 (left) and O32 = 4 (right). In the middle panel we show a similar plot for our SDSS comparison sample 1 (see the text for details). The distribution of the difference in O32 of each galaxy in our sample with its counterpart in the SDSS comparison sample is shown in the right panel. The median and the 1-σ spread of the distribution are shown by the solid and dashed blue lines respectively.
Current usage metrics show cumulative count of Article Views (full-text article views including HTML views, PDF and ePub downloads, according to the available data) and Abstracts Views on Vision4Press platform.
Data correspond to usage on the plateform after 2015. The current usage metrics is available 48-96 hours after online publication and is updated daily on week days.
Initial download of the metrics may take a while.