Free Access
Fig. 4
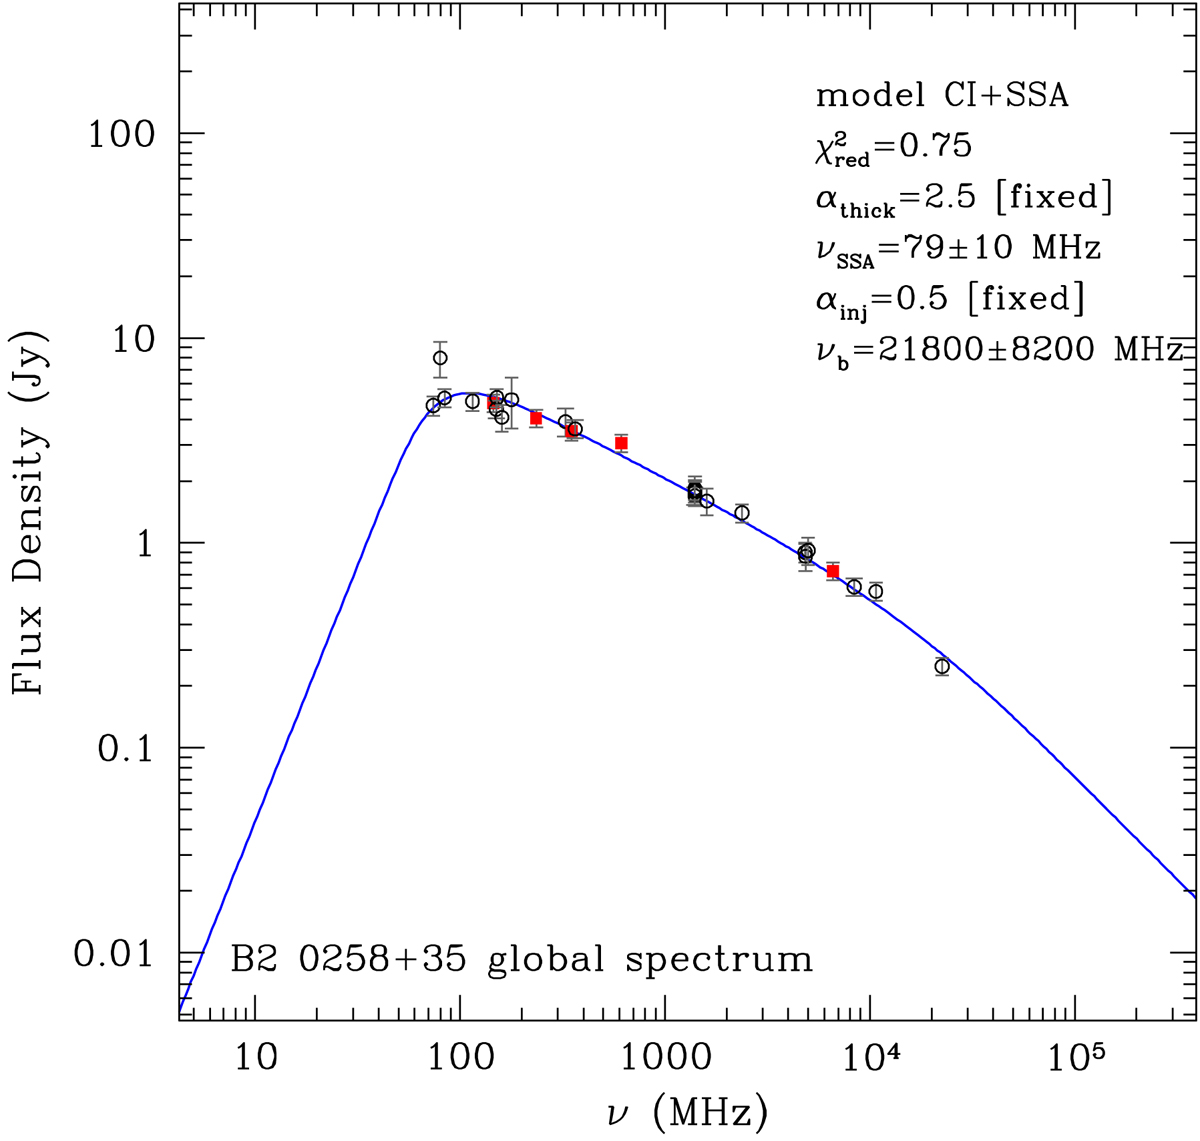
Integrated radio spectrum of the central CSS source and best fit model. Red squares represent the flux density measurements presented in this paper, while black open circles are taken from literature. The entire list of flux densities used in the plot with respective errors and references is presented in Table 6.
Current usage metrics show cumulative count of Article Views (full-text article views including HTML views, PDF and ePub downloads, according to the available data) and Abstracts Views on Vision4Press platform.
Data correspond to usage on the plateform after 2015. The current usage metrics is available 48-96 hours after online publication and is updated daily on week days.
Initial download of the metrics may take a while.