Fig. 3
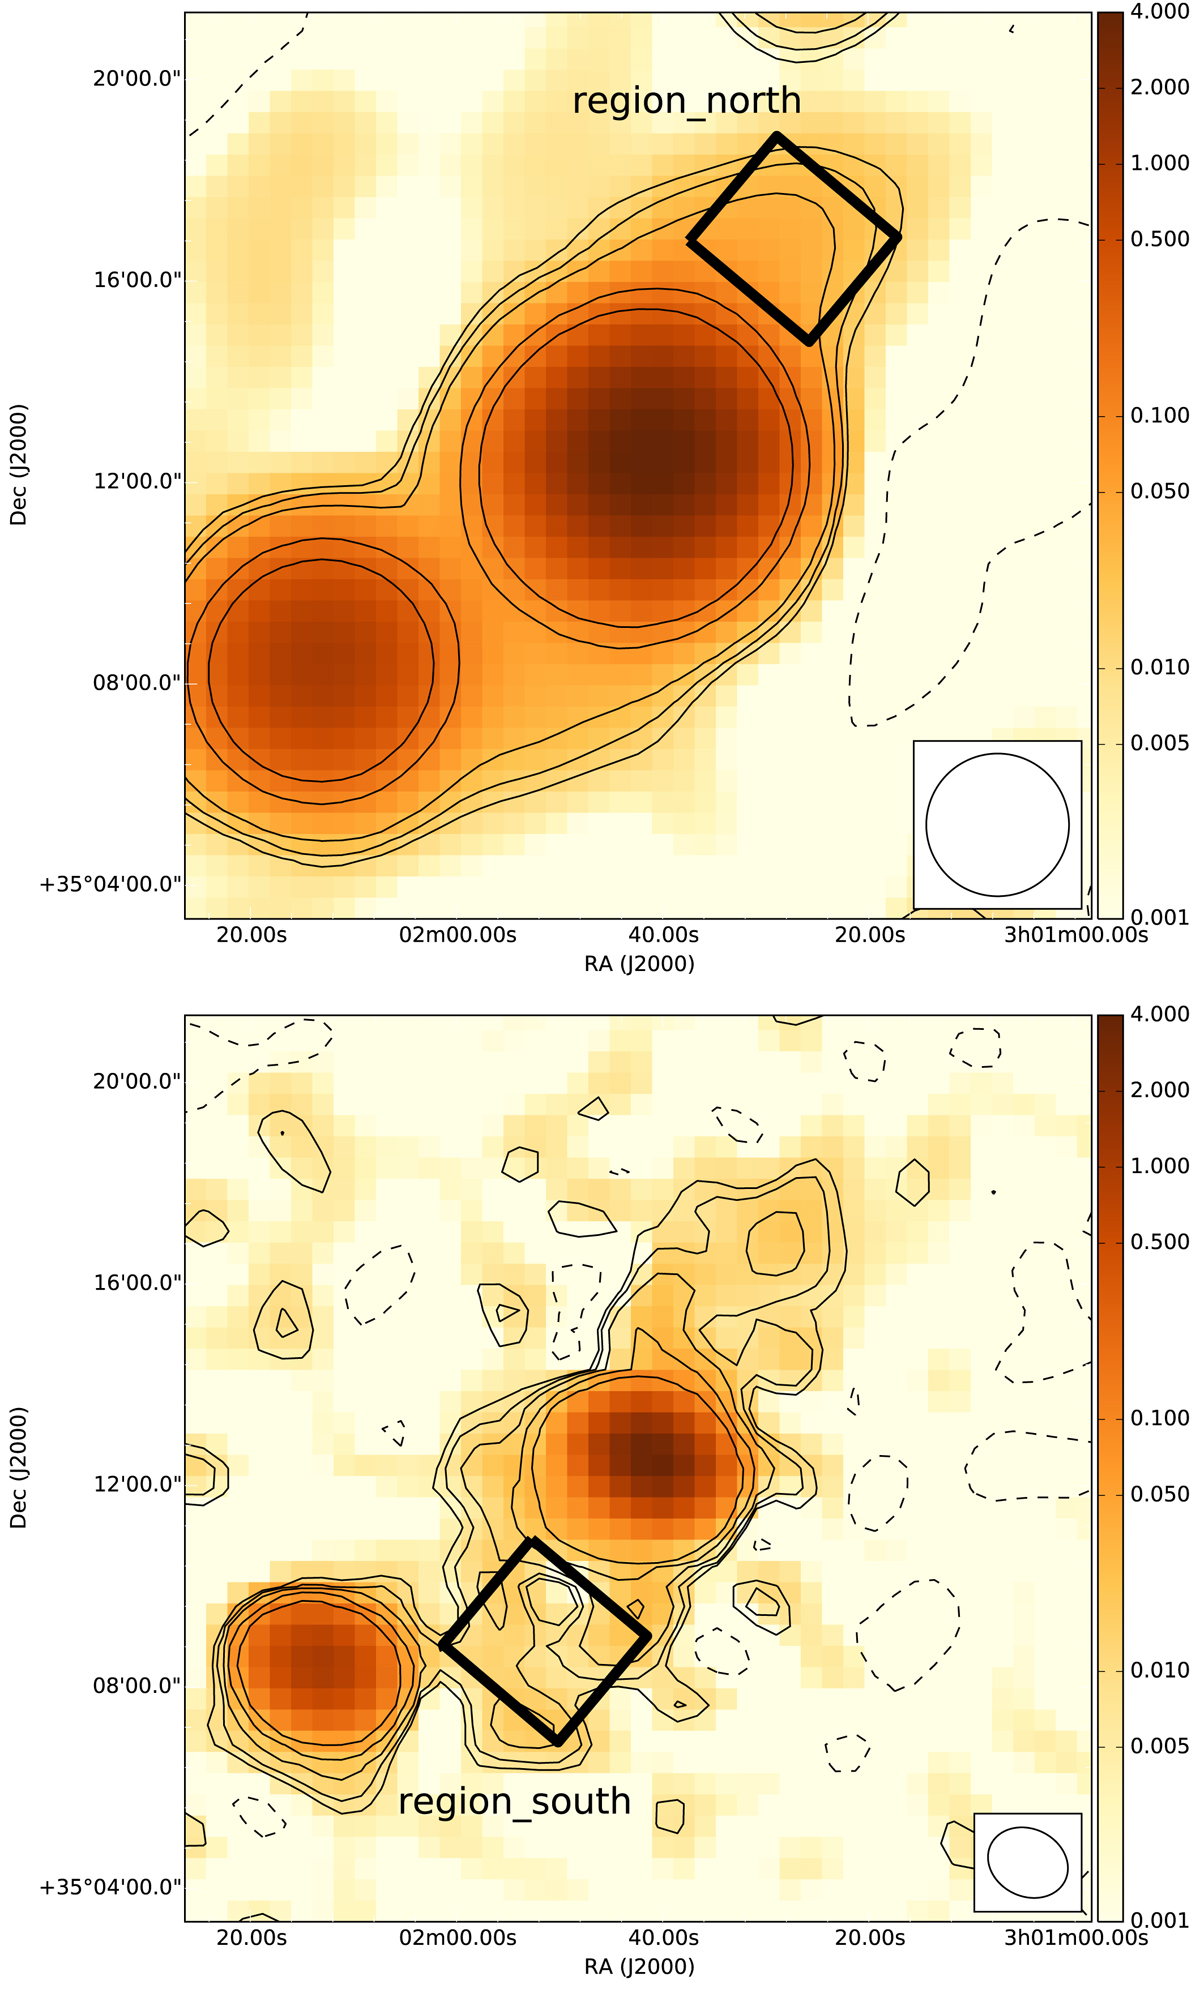
Top panel: LOFAR image at 145 MHz convolved to 2.9-arcmin resolution. Contours represent −2, 2, 3, 5, 10, 20 × σ (5 mJy beam−1). Bottom panel: LOFAR image at 145 MHz and 80 arcsec × 98 arcsec resolution. Contours represent −2, 2, 3, 5, 10, 20 × σ (3 mJy beam−1). The black regions represent the boxes used to extract the flux density in the northern lobe and southern lobe respectively. The colour scale is set in Jy beam−1.
Current usage metrics show cumulative count of Article Views (full-text article views including HTML views, PDF and ePub downloads, according to the available data) and Abstracts Views on Vision4Press platform.
Data correspond to usage on the plateform after 2015. The current usage metrics is available 48-96 hours after online publication and is updated daily on week days.
Initial download of the metrics may take a while.