Fig. 1
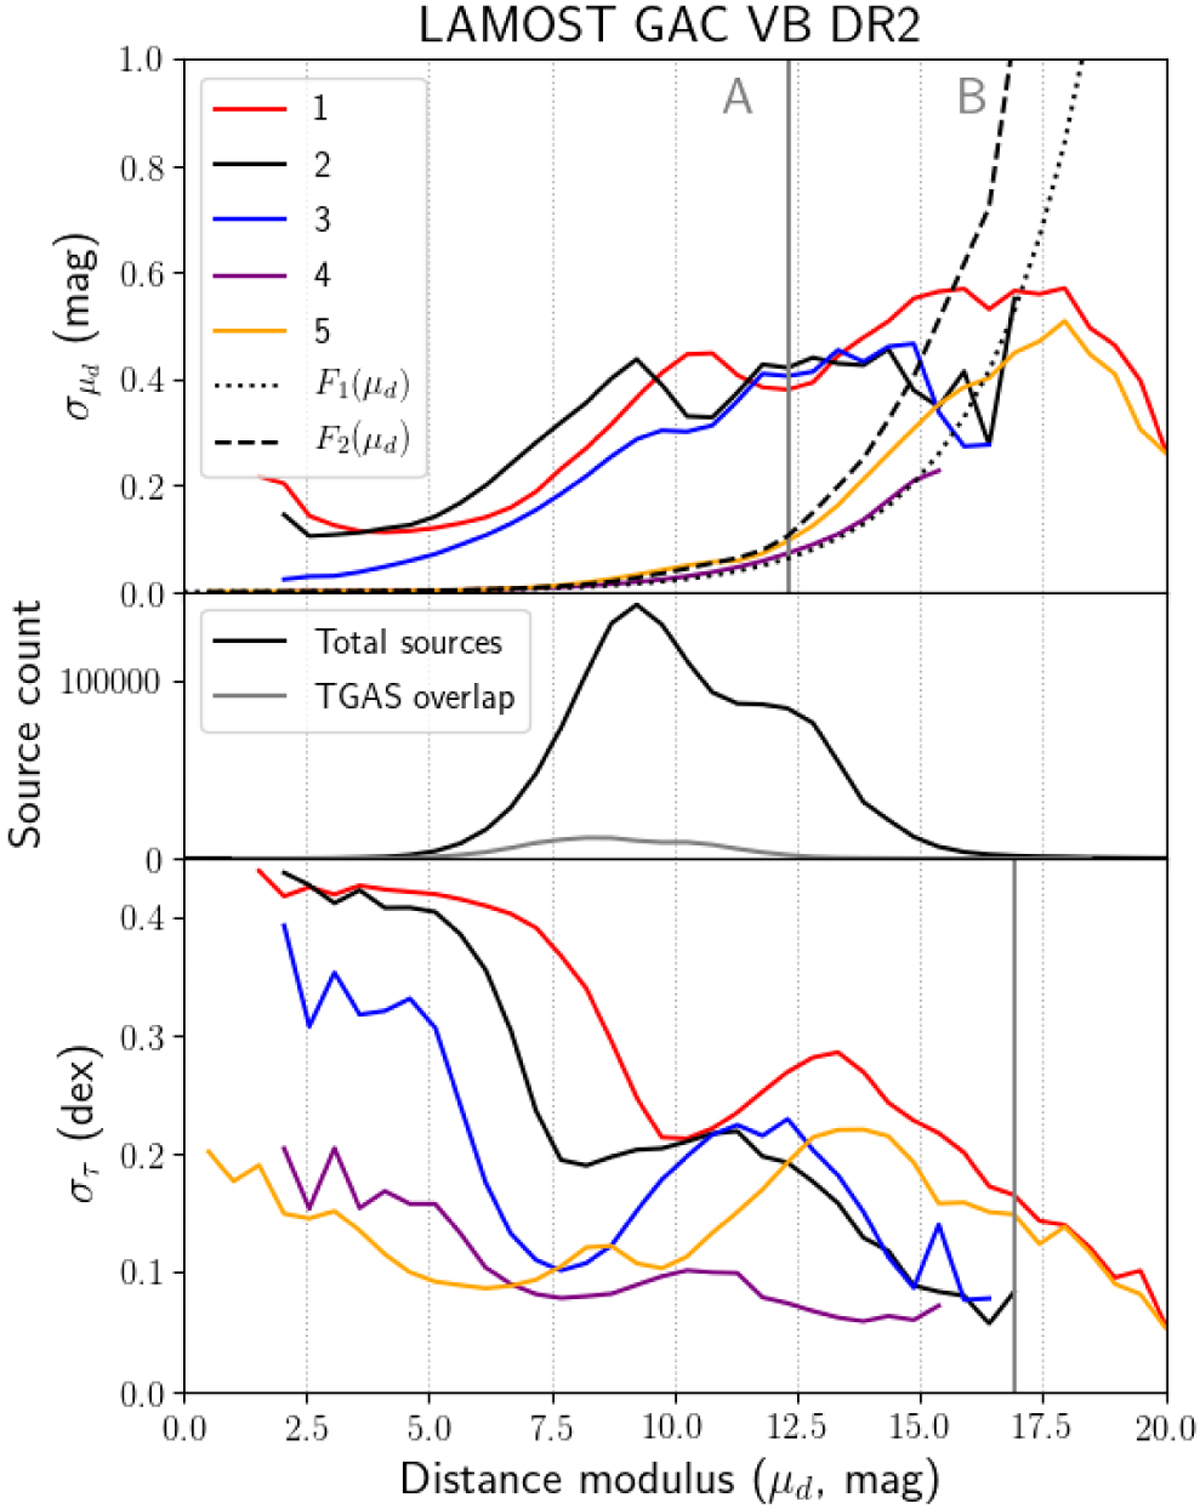
Distance modulus uncertainties ![]() (top panel) and log(age) uncertainties στ (bottom panel) as functions of the distance modulus. Lines show median values in 0. m 5 distance modulus bins. Colours are for datasets: dataset 1 – complete survey (red); dataset 2 – TGAS overlap (black); dataset 3 – TGAS overlap with TGAS parallaxes (blue); dataset 4 – TGAS parallaxes with EoM precisions (magenta); dataset 5 – UniDAM parallax with EoM precisions (orange). We show only distance modulus bins with at least five stars so as to reduce the noise. Therefore, the distance modulus range presented can differ for different datasets, especially for surveys with small overlap with TGAS The dotted black line shows F1 (μd), the dashed black line shows F2(μd) (as described in Sect. 4.1). Vertical grey lines and grey labels at the top panel mark borders between ranges A, B, and C (see Sect. 4.1 for details). Vertical grey line at the bottom plot marks maximum distance modulus for which the use of parallaxes gives at least 10% improvement in log(age) uncertainty (see Sect. 4.2). Middle panel: total number of stars in the survey (black) and the number of stars in overlap with TGAS (grey) as a function of distance modulus.
(top panel) and log(age) uncertainties στ (bottom panel) as functions of the distance modulus. Lines show median values in 0. m 5 distance modulus bins. Colours are for datasets: dataset 1 – complete survey (red); dataset 2 – TGAS overlap (black); dataset 3 – TGAS overlap with TGAS parallaxes (blue); dataset 4 – TGAS parallaxes with EoM precisions (magenta); dataset 5 – UniDAM parallax with EoM precisions (orange). We show only distance modulus bins with at least five stars so as to reduce the noise. Therefore, the distance modulus range presented can differ for different datasets, especially for surveys with small overlap with TGAS The dotted black line shows F1 (μd), the dashed black line shows F2(μd) (as described in Sect. 4.1). Vertical grey lines and grey labels at the top panel mark borders between ranges A, B, and C (see Sect. 4.1 for details). Vertical grey line at the bottom plot marks maximum distance modulus for which the use of parallaxes gives at least 10% improvement in log(age) uncertainty (see Sect. 4.2). Middle panel: total number of stars in the survey (black) and the number of stars in overlap with TGAS (grey) as a function of distance modulus.
Current usage metrics show cumulative count of Article Views (full-text article views including HTML views, PDF and ePub downloads, according to the available data) and Abstracts Views on Vision4Press platform.
Data correspond to usage on the plateform after 2015. The current usage metrics is available 48-96 hours after online publication and is updated daily on week days.
Initial download of the metrics may take a while.