Fig. A.1
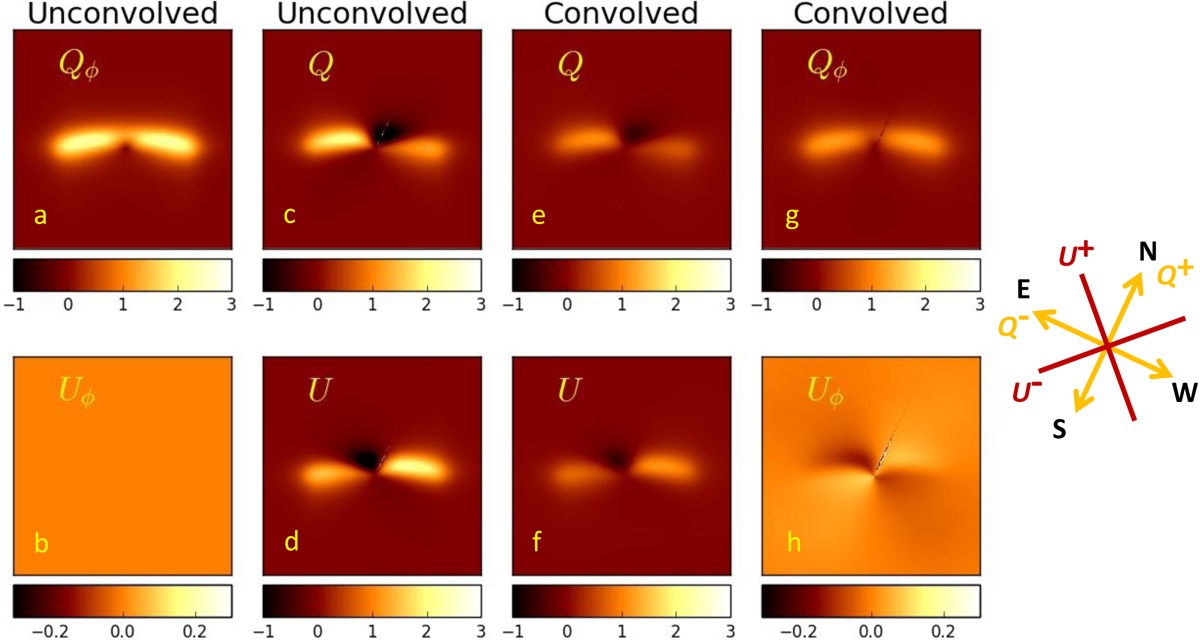
Model images of the polarized flux from HD 172555 debris disk. Images were generated using the parameters of mean model (Col. 5 in Table 2) and illustrate the individual steps of the modeling procedure (from left to the right panels) to obtain the final synthetic Qφ and Uφ images (panels g and h). For a detailed description of the presented images, see Appendix A. The diagram on the right side of the figure explains orientation of the axes used to measure the Stokes Q and U parameters as implemented in ZIMPOL instrument. The diagram shows also the orientation of north and east in each image. The north is rotated by 22° clockwise from the vertical line to have disk axis in horzontal position. Nonalignment of the disk axes with the Q and U measuring axes causes asymmetric flux distribution in Q and U images (panels c–f).
Current usage metrics show cumulative count of Article Views (full-text article views including HTML views, PDF and ePub downloads, according to the available data) and Abstracts Views on Vision4Press platform.
Data correspond to usage on the plateform after 2015. The current usage metrics is available 48-96 hours after online publication and is updated daily on week days.
Initial download of the metrics may take a while.