Fig. 6
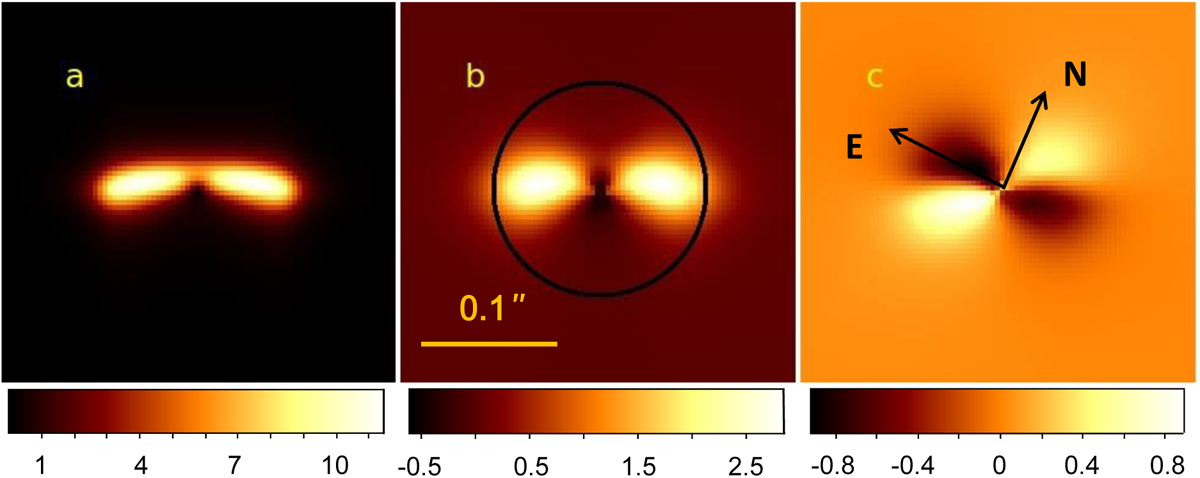
Model of the small debris disk that could be hidden behind the coronagraphic mask. The model parameterscorrespond to those of the mean model (Table 2) except the radius of the belt and scale height of the dust vertical distribution, which are reduced by a factor of 5. Panel a: Qφ image of the debris disk model showing the polarized intensity before being convolved with the instrumental PSF. Panel b: Qφ image of the debris disk model showing the polarized intensity after convolution with the instrumental PSF. The black circle denotes the edge of the coronagraphic mask. Panel c: Uφ image of the model demonstrating nonzero Uφ signal appearing after convolution of the Stokes Q and U parameters with the instrumental PSF. The color bars show counts per pixel.
Current usage metrics show cumulative count of Article Views (full-text article views including HTML views, PDF and ePub downloads, according to the available data) and Abstracts Views on Vision4Press platform.
Data correspond to usage on the plateform after 2015. The current usage metrics is available 48-96 hours after online publication and is updated daily on week days.
Initial download of the metrics may take a while.