Fig. 4
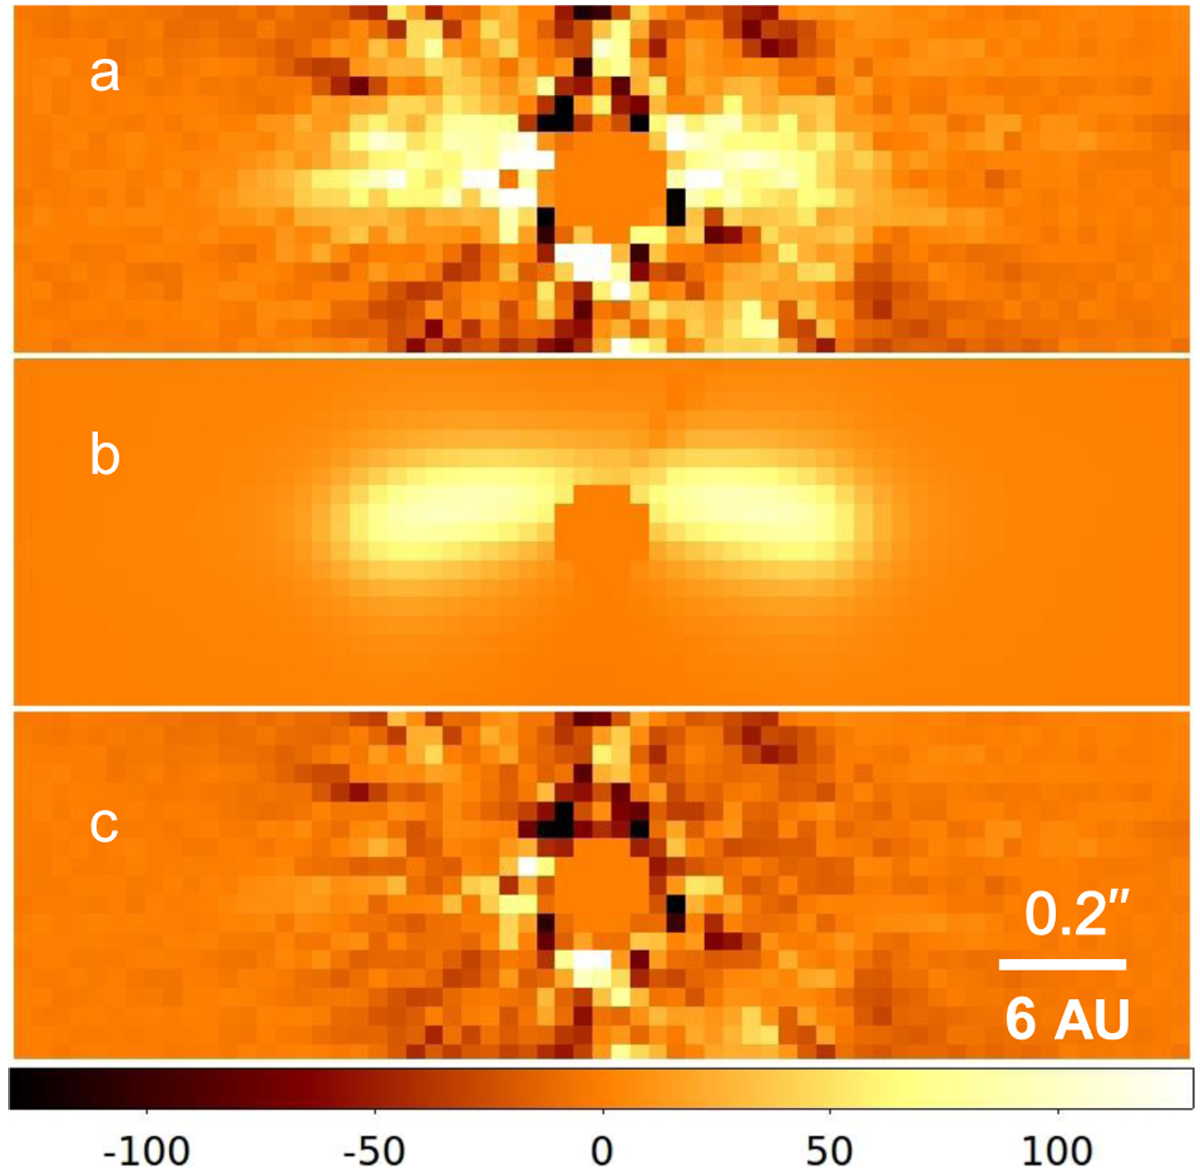
Comparison of the grid model with the Qφ image. Panel a: Qφ image after 8 × 8 binning. Panel b: image of the best-fitting grid model convolved with the instrumental PSF. Panel c: residual image obtained after subtraction of the PSF-convolved grid model image (panel b) from the Qφ image (panel a). Color bar shows flux in counts per binned pixel.
Current usage metrics show cumulative count of Article Views (full-text article views including HTML views, PDF and ePub downloads, according to the available data) and Abstracts Views on Vision4Press platform.
Data correspond to usage on the plateform after 2015. The current usage metrics is available 48-96 hours after online publication and is updated daily on week days.
Initial download of the metrics may take a while.