Fig. 3
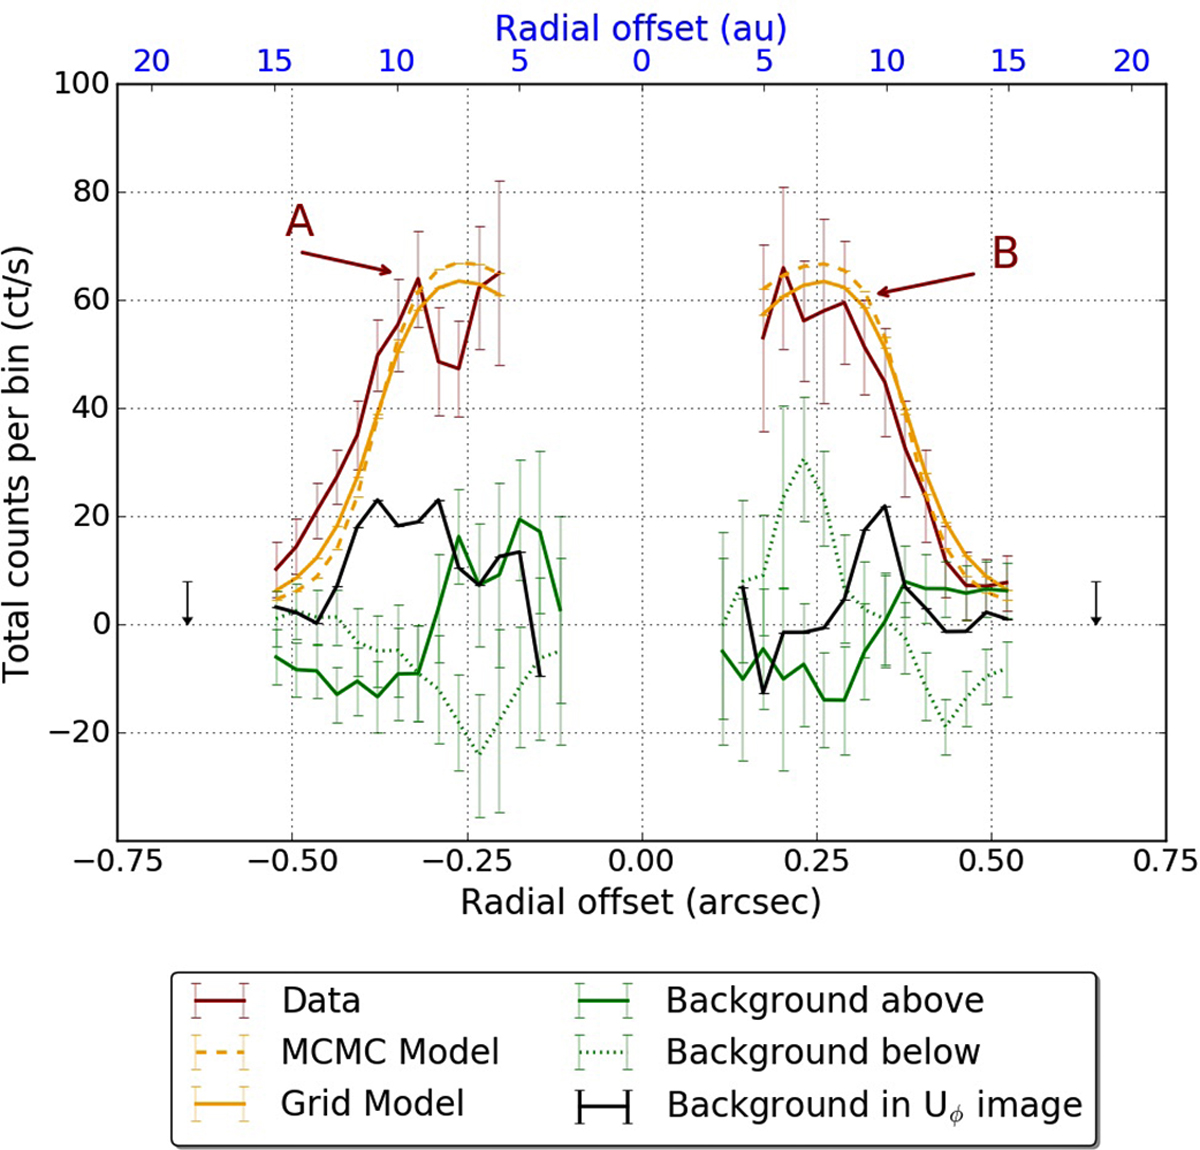
Radial polarized flux profile measured in the Qφ image per 0.029″(Δx) × 0.290″(Δy) bin (red solid line) compared with profiles of the best-fitting models and background. The background above (green solid line) and below (light green dotted line) the disk midplane and the background in the Uφ image (black solid line) are calculated as explained in Sect. 5. The upper limit is set for the polarized flux per bin for the disk regions beyond r = 0.53″. The arrows “A” and “B” point to the surface brightness peaks.
Current usage metrics show cumulative count of Article Views (full-text article views including HTML views, PDF and ePub downloads, according to the available data) and Abstracts Views on Vision4Press platform.
Data correspond to usage on the plateform after 2015. The current usage metrics is available 48-96 hours after online publication and is updated daily on week days.
Initial download of the metrics may take a while.