Fig. 2
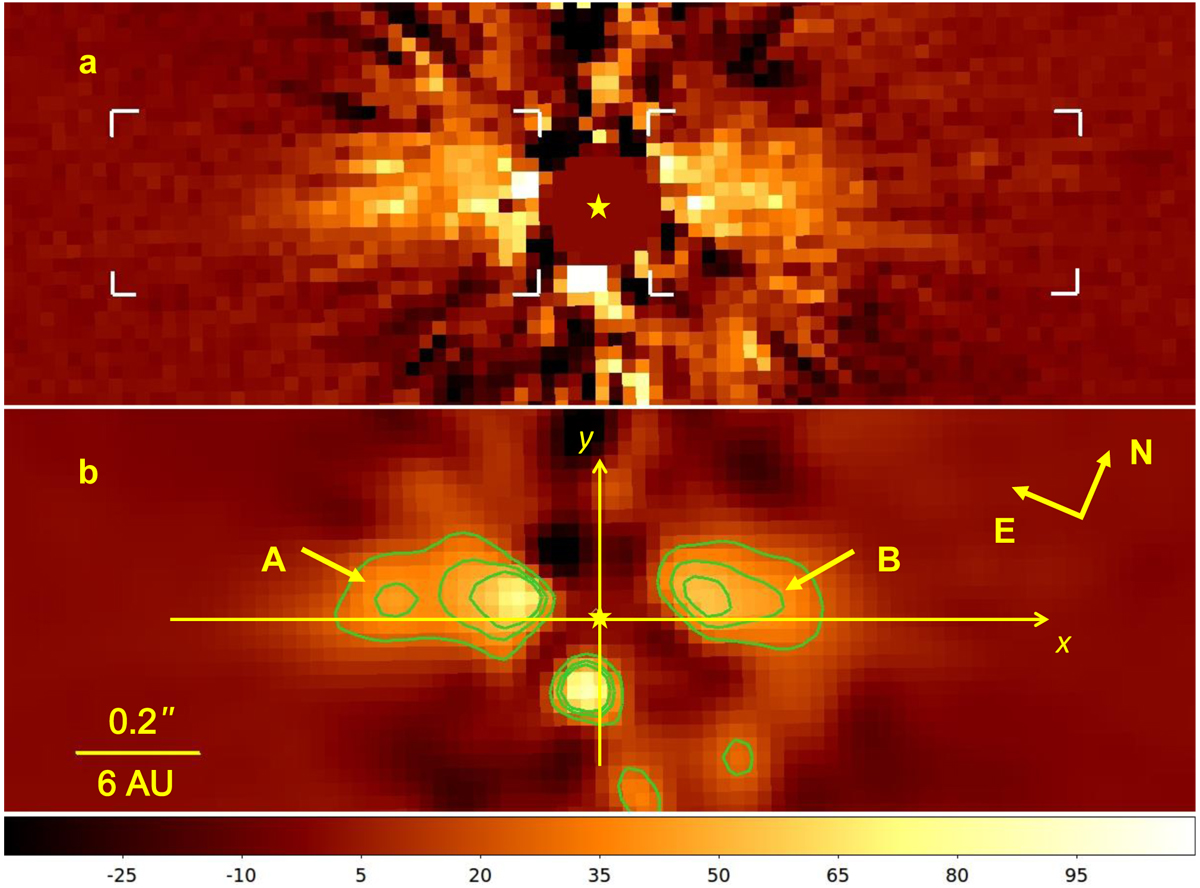
Qφ image (panel a) and isophotal contours of polarized light intensity overlying the Qφ image (panelb). The original data (OBS177_0010-0042) were 6 × 6 binned to highlight the disk shape and to reduce the photon noise level. The position of the star is indicated by a yellow asterisk. White brackets in the top panel show the boundaries of two rectangular areas where the counts were summed up to retrieve the total polarized flux of the disk (see Sect. 5.3). Image (panel b) is smoothed via a Gaussian kernel with σkernel = 3 px. The isophotal contours show levels of the surface brightness with approximately 25, 40, and 50 counts per binned pixel (from the lowest to the highest contour). Arrows “A” and “B” mark the location of the increased surface brightness, which could indicate the radius of the planetesimal belt. The x-axis coincides with the disk axis at estimated PA θdisk = 112° (see Sect. 5). The color bar shows the surface brightness in counts per binned pixel.
Current usage metrics show cumulative count of Article Views (full-text article views including HTML views, PDF and ePub downloads, according to the available data) and Abstracts Views on Vision4Press platform.
Data correspond to usage on the plateform after 2015. The current usage metrics is available 48-96 hours after online publication and is updated daily on week days.
Initial download of the metrics may take a while.