Fig. 2.
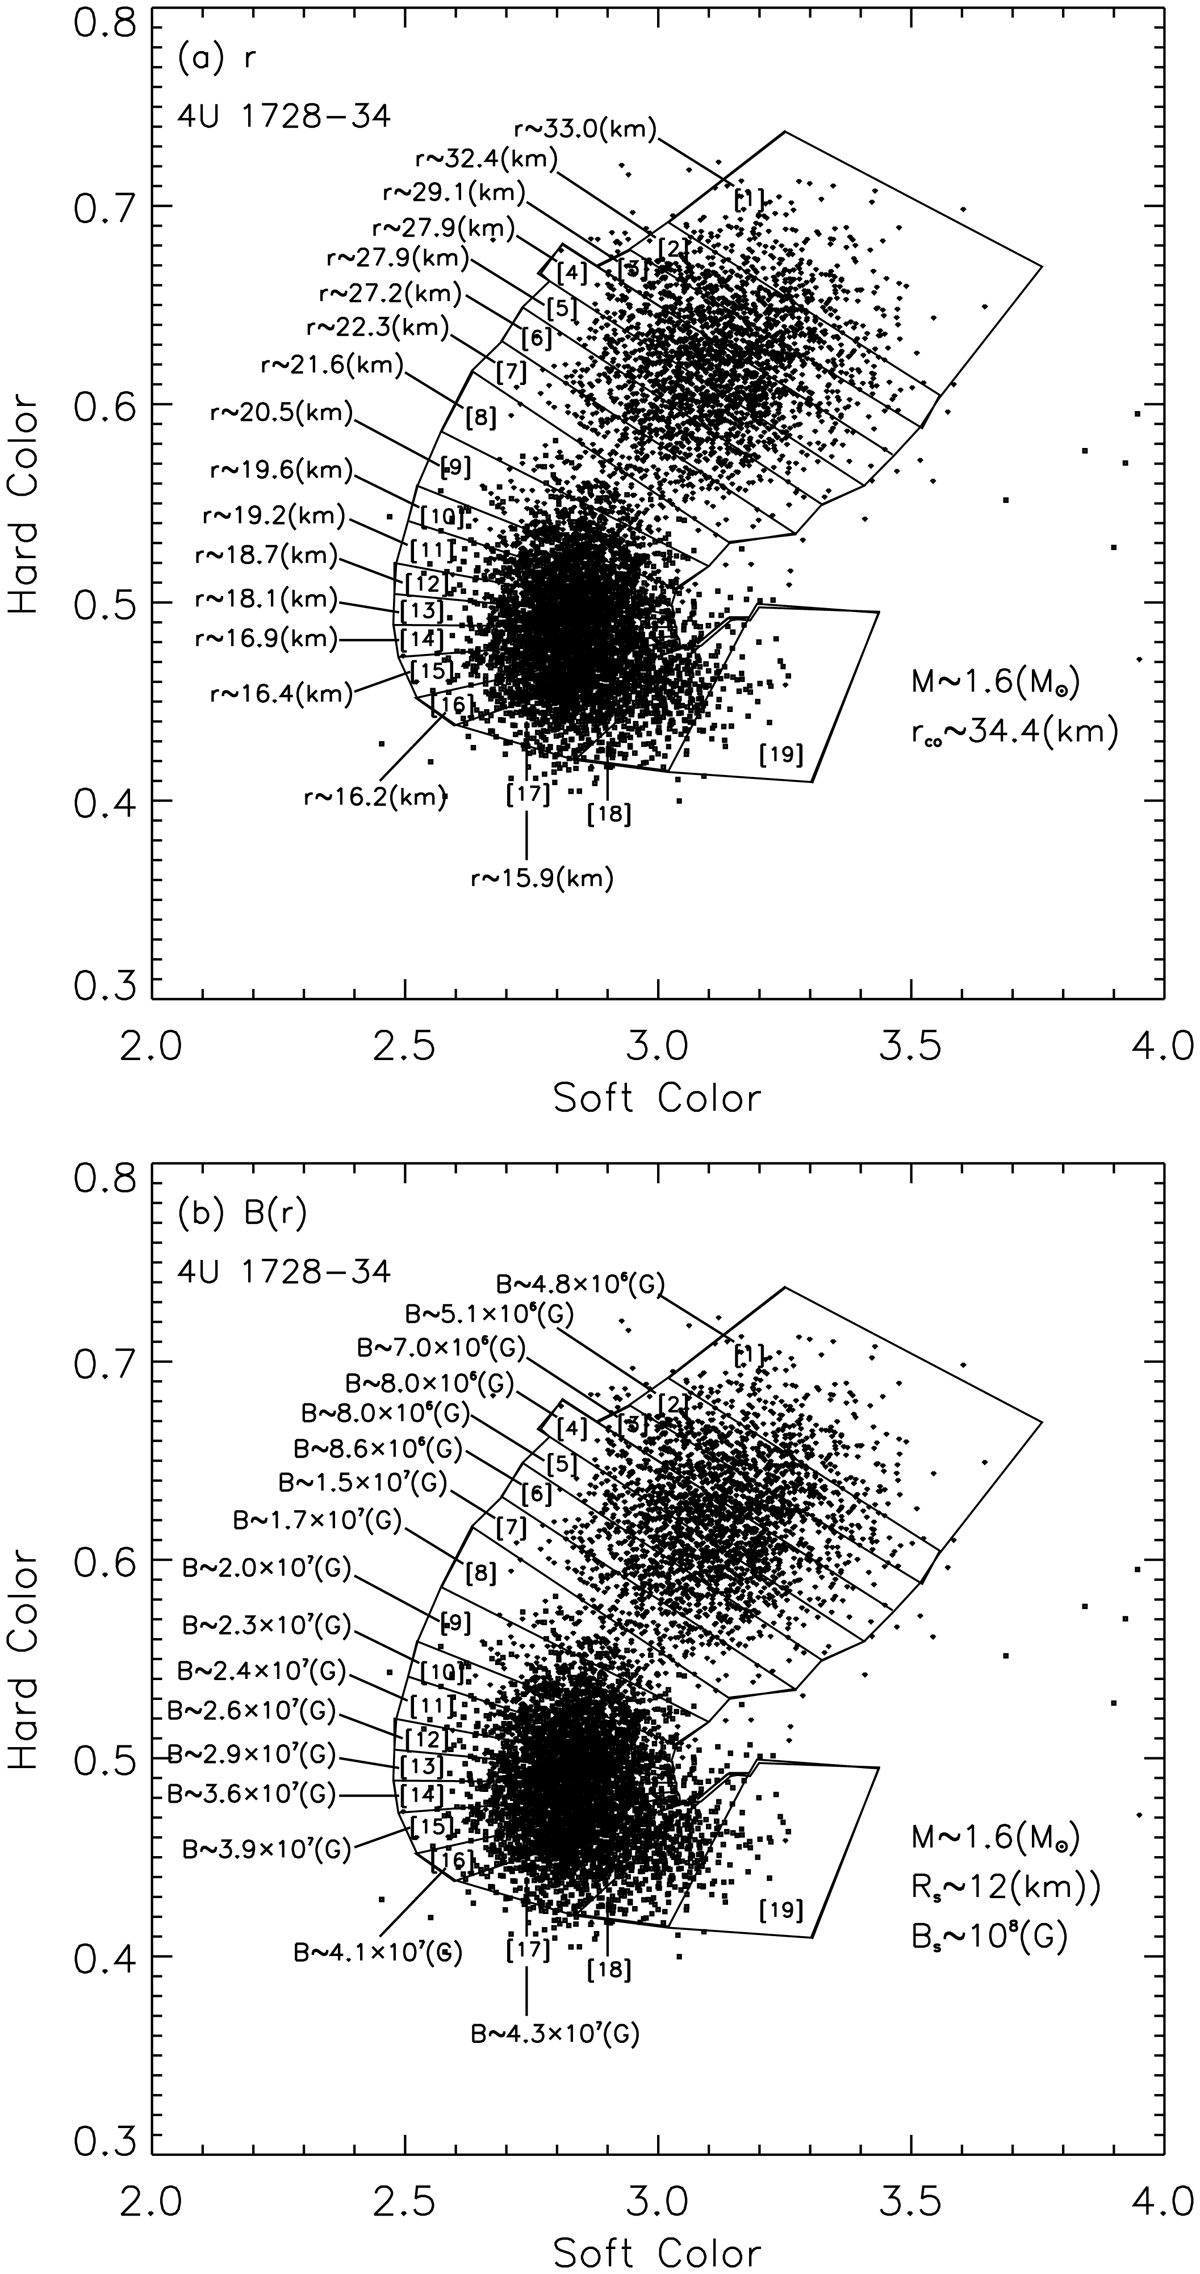
Panel a: magnetosphere-disk radius r at various positions (interval [1]–[17]) in X-ray color–color diagram. Panel b: similar to (panel a), but for the magnetic field strength B at r. The observed CCD points of 4U 1728-34 are taken from the paper by Di Salvo et al. (2001). The figure is reproduced with the RXTE dataset used by Di Salvo et al. (2001).
Current usage metrics show cumulative count of Article Views (full-text article views including HTML views, PDF and ePub downloads, according to the available data) and Abstracts Views on Vision4Press platform.
Data correspond to usage on the plateform after 2015. The current usage metrics is available 48-96 hours after online publication and is updated daily on week days.
Initial download of the metrics may take a while.